
Empowering Restaurants Through Data-Driven Decision-Making
Leveraging Technology and Metrics for Success in the Restaurant Industry
From supply chain issues to rising employee wages, there’s no shortage of hurdles for restaurants to overcome in today’s market. Being able to access up-to-date, high-quality restaurant data is essential to making informed decisions to respond to the winds of change. Digital technology has made information more accessible than ever, but capturing that data and turning it into actionable insights is still a challenge for many operators. The most successful brands are leveraging the data from technology, along with restaurant industry trends, online reviews, and consumer intelligence to drive profits despite uncertainty.
The key is understanding which restaurant metrics matter most and how seemingly disparate data sets impact one another, as well as finding a restaurant analytics company that makes it easy for you. For restaurant operators with 10 or more locations, Black Box Intelligence’s (BBI) restaurant analytics software enables you to monitor your performance holistically so you can set successful strategies. Know what your guests are saying about you, how your workforce metrics stack up against the competition, and see all of your financial data with a single tool. We add industry-wide data so you can also track restaurant trends by category, segment, region, or across the entire sector. Because we work with many of the leading brands in the industry, you can be confident that our competitor data accurately represents the market.
Here’s a breakdown of what’s included in our restaurant reporting solutions and how you can use it to drive business and implement more effective strategies.
Unlocking Success with BBI’s Restaurant Data: From Guest Response to Strategy Enhancement
Whether you want to take a bird’s-eye-view and track restaurant benchmarks or hone in on how guests are responding to your newest menu item, BBI’s solutions shed light on the aspects of your business performance that can’t be captured in surveys. For sports bar franchise Twin Peaks, which has continued to grow throughout the pandemic and was part of one of the industry’s biggest restaurant acquisitions in 2021, BBI data has been essential to sharpening its strategy.
“It has helped us understand where our strengths and weaknesses are, what makes our guests come back and what keeps them away. From there, we are able to create plans to maintain our strengths, while focusing on our weaknesses.”
Our standalone solutions offer you simplified access to restaurant analytics that help you understand your customers, your employees, and your competitors. Here are the solutions we offer, and the restaurant KPIs we help you track.
Financial Intelligence – Everything you need to know about your restaurant sales
Tracking sales is central to any restaurant’s data-collecting strategy. Understanding your restaurant’s financials is essential to driving profits. BBI’s Financial Intelligence solution provides restaurant sales data and restaurant traffic data for any period you choose. View comparable data from any period to monitor your performance over time. And drill down for more granular details, such as food vs. beverage sales.
Here are the restaurant sales statistics you can track with Financial Intelligence from BBI:
- Restaurant sales revenue (view holistic data or zoom in on food, beverage, dine-in, to-go and more)
- The average check per person
- Sales per labor hour
- Restaurant traffic
- Per person average (PPA)
Access restaurant daily sales reports and weekly benchmarks broken out by day part, segment, region, cuisine, and state. And because we track restaurant industry sales for so many brands, you can compare your financial data to others in your segment or your designated market area. You can also view restaurant industry data to gain insight into how the sector as a whole is performing.
Accurate, up-to-date restaurant financial data puts you in the driver’s seat to improve performance and outpace your competitors. On a day-to-day or monthly basis, it allows you to put restaurant foot traffic, sales, and labor costs in perspective and it supports the development of more detailed quarterly and yearly restaurant financial statements.
Our data also helps you put your performance in context. For example, if your sales are slumping, you can view broader restaurant data to see whether the rest of the industry, segment, or local area is experiencing the same downturn. Having a better grasp of the market as a whole gives you a competitive advantage since you can make more strategic decisions about how to address it. With a keen understanding of your restaurant finances, you can identify opportunities to innovate and reduce the risk of implementing new ideas.
Guest Intelligence – Put restaurant reviews in perspective
Post-pandemic, the relationship between customers and restaurants has evolved, and many experts say the changes are permanent. Digital ordering, contactless payments, and off-premise dining are up, and restaurant guest expectations have changed. At the same time, review sites provide customers with a larger platform than ever to share their experiences with your business and shape your restaurant’s online reputation. Ideally, these reviews should be a part of your restaurant data analytics. The challenge is gathering it all effectively and efficiently.
BBI’s Guest Intelligence solution provides an aggregated view of what guests are saying about your restaurants and others in your industry/segment/area. We pull restaurant feedback from online review sites and use natural language processing to understand the sentiment for food, beverage, service, ambiance, value, and intent to return. You can drill down by creating custom classifications to track specific menu items, promotions, etc. You can also view restaurant customer feedback on your competitors. Since reviews are public, we can show you this data at the brand level.
Restaurant guest satisfaction can be hard to track. But with BBI consolidating disparate restaurant review data into a single report, it’s easy to monitor trends. In addition to monitoring your guest data, see how your competitors’ specials, menu items, etc. are performing with customers to give yourself a competitive advantage. Be more informed as you implement and adjust your restaurant reputation management programs.
Workforce Intelligence – From restaurant salaries to turnover rates, get insights on your employees
The historic staffing crisis has many industry experts scratching their heads trying to uncover the reasons for the worker shortage. The causes for the sky-high restaurant turnover rate vary – from lack of childcare to employees moving to other industries. Restaurant human resources professionals have to get creative to attract and retain high-quality candidates. Gathering restaurant reporting and analytics on the workforce can help set that strategy.
Our Workforce Intelligence solution includes monthly benchmarks for restaurant turnover and staffing levels. See how many employees are working per unit. View restaurant demographics – age, gender, etc. See data on compensation for restaurant employees including annual bonus and cash compensation metrics. Drill down to view data and restaurant trends by industry, DMA, or segment.
With Workforce Intelligence, you gain access to restaurant business intelligence that will help you address the ongoing labor shortage. See how your restaurant’s employee benefits stack up compared to the rest of the marketplace. Implement strategies that help you retain your workforce and track how well your efforts are working.
The Scorecard: Gain a Comprehensive View of Your Restaurant Data
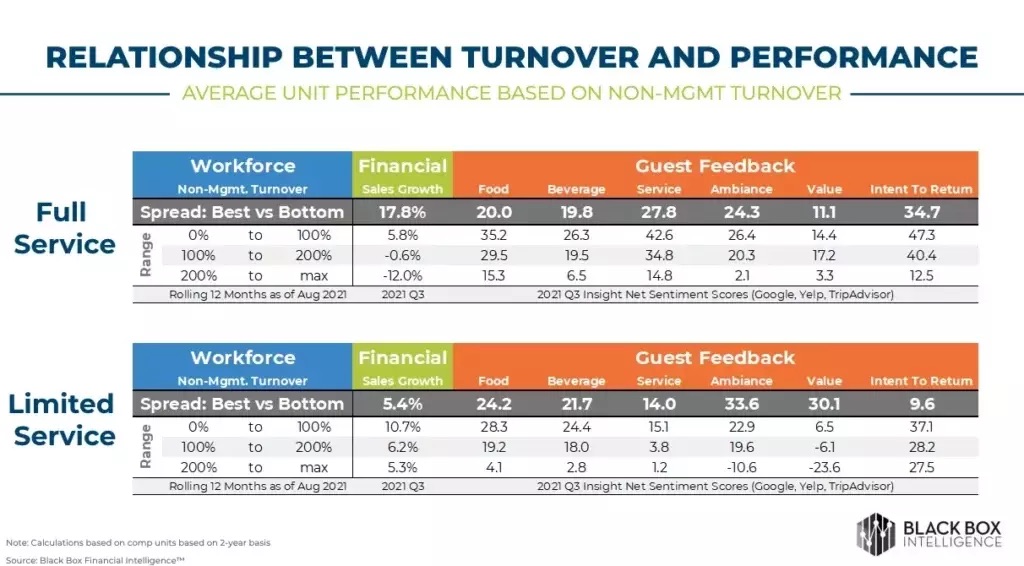
Do you want restaurant reports that give you the bird’s-eye-view of your business operations? You can combine all three restaurant data solutions in a single platform to gain a better perspective on how you’re truly performing. We provide a quarterly performance review, which includes a reference tool known as The Scorecard, so you can look at all of your data points on the workforce, your financials, and guest sentiment in a single report. This allows you to identify broader restaurant industry metrics and understand how different aspects of your business affect others.
For instance, even if sales are up, your guest sentiment may be trending down. Being able to take a closer look at your restaurant data analytics can alert you to the problem and help you figure out why. Maybe you had a rush of traffic due to a promotion, but the long lines caused service sentiment to sink. Or, maybe your staffing wasn’t sufficient. With the quarterly scorecard, you can see the most critical restaurant data in a single snapshot.
Along with restaurant reports, our team can offer insights on trends that we see in your business. For example, we can alert you to rising complaints about portion size, or food quality so you can address them early. Ready to get access to the restaurant data that will help you identify opportunities to improve revenue? Sign up here to get your scorecard.