
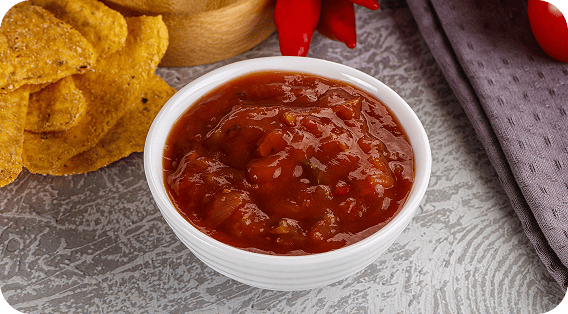
Salsa Roja
Would you recommend it?
What about these?
Inspire others
What’s one thing we could change about
the it to make it better?

How would you rate the {{menu_item}}
compared to your usual order here?


Were you greeted in a warm and friendly manner?
Was the team knowledgeable about the food and drinks?
Was there a manager available if you needed something?
Did our team ask if you have any allergies or dietary requirements?
How would you rate the friendliness of the team today?
Were you informed of any specials offered?
Did you receive your items promptly after ordering?
Was your order accurate, including any requested modifications? (On-premise, delivery, and collection)
Was your order ready for collection when you arrived?
How would you rate the speed of service today?

Was your order packaged with hot and cold food separated?
Did your food look as expected when it arrived?
Was your order well-packaged?
How would you rate the ordering experience?
(Delivery and digital ordering)
How would you rate the ease of picking up your order?
(Collection / Takeout)

How would you rate the ease of our ordering system?
Was the ordering format explained when you arrived?
Overall, how would you rate your
experience today?
How likely are you to recommend [Brand]
to a friend or family member?
How likely are you to return to this location
in the next three months?

Had you heard about us before purchasing your items?
Do you follow us on any social media?
Are you a member of our loyalty program?
Have you visited us in the last 3 months?

What’s the one thing we could have done better today?
Is there anything else you’d like to tell us about your experience today?
Ideally, your POS feeds menu items straight into the survey and, behind the scenes, lets you rank which dishes you most want feedback on. That keeps those items at the front of the queue and gives you the richest data on what matters most to your business.
If POS integration isn’t available, let guests choose which items they want to review. This still has real value—it highlights what they care about most and often surfaces issues or opportunities you weren’t even looking for.
Item-level read on loyalty for any dish, especially signatures and new launches where you want to know if they’re “worth talking about.”
Lets you see which items create true fans. You can rank dishes by % of “Yes,” compare across locations and channels, and link recommendation rates to repeat orders, attach rates, and menu placement decisions.
Feels natural and simple—guests instantly understand the question and like being asked whether this dish is good enough to recommend.
Visual-forward items where presentation matters (burgers, bowls, desserts, cocktails, social-media-friendly plates).
Separates visual appeal from taste and value. If LOOK underperforms while TASTE is strong, you know to focus on plating, garnishes, or packaging—instead of changing the recipe.
Feels quick and intuitive. Guests are used to reacting to how food looks, and a simple thumb up/down is low effort.
Any menu item, but especially core entrées and sauces that define the brand and/or dishes where you compete on flavor.
Gives a clean, binary read on whether the flavor hit the mark. Aggregated over time, it highlights recipes that need reformulation and confirms which items are delivering on your brand promise.
This is the question they expect—“Did it taste good?”—so it feels honest and straightforward. It’s simple and easy—guests instinctively know how they felt about taste.
Concepts balancing food cost and perceived value—fast casual, full service, and family-style especially.
Shows if guests feel the serving size is right for the price and occasion. When PORTION scores lag, you can revisit plating, shareability, or bundling before guests drift to competitors.
Guests often have strong feelings about “enough food,” so being asked directly about portion size feels fair and validating.
Any brand navigating price increases or premium positioning.
Connects price to perceived worth at the item level. You can see which dishes feel overpriced, which could carry a higher price, and how value perceptions differ by venue, daypart, or channel.
Signals that you know money matters. Guests appreciate being asked whether the dish felt “worth it,” not just whether it tasted good.
Capturing rich, positive comments on hero items—from dine-in experiences to off-prem “wow” moments.
Generates high-quality, item-specific praise you can mine for themes (craveable flavors, consistency, portion generosity) and re-use in marketing or in-app recommendations. It also helps explain why LOOK/TASTE/PORTION/VALUE got a thumbs up.
Feels like an invitation to brag about a dish they loved. It turns happy guests into storytellers and makes them feel their opinion can influence other diners.
Understanding key context on why a dish disappointed. Crucial information for adjusting flavor, portion size or whatever other reason why your guest didn’t like the dish.
Generates targeted, item-specific suggestions (less sauce, more crunch, different bun, spice level) that culinary teams can test and quantify.
Feels collaborative and constructive; they’re helping you “tune” a specific dish rather than just venting.
LTOs and new items that are designed to steal share from an existing favorite.
Shows whether the new item is actually moving guests away from their go-to choice or underperforming versus the staple. Helps decide if the item should stay, change, or go.
Invites a direct comparison to their “usual,” which makes them feel like you understand their habits.
Any restaurant brand as the main “pulse check” (sub in specific wording as appropriate). This should be your CSAT, NPS, OSAT etc. question that provides your overall measure.
Gives you a single metric to track overall guest satisfaction, compare locations, and monitor trends over time. Can be segmented across channels (dine-in vs off prem), dayparts, guest demographics etc.
Feels familiar and straightforward—guests understand they’re giving an overall score.
Brands focused on word-of-mouth and loyalty, especially multi-unit operators tracking brand advocacy.
Acts as a loyalty signal; lets you segment “promoters” vs “detractors” and compare advocacy between locations and channels.
Signals that you care whether they’d stake their reputation on you, which most guests recognize as important.
Neighborhood concepts, casual dining, and quick service brands relying on frequent repeat visits.
Provides a forward-looking indicator of visit frequency that can be linked to sales projections and marketing efforts.
Encourages them to think about returning, which can reinforce intent to come back.
Full-service and quick-service locations where first impressions at the door or counter are critical.
Helps quantify basic hospitality execution by location, shift, or daypart, and ties directly to training.
Reassures guests that you see warmth and friendliness as non-negotiable parts of the experience.
Concepts with complex menus, seasonal items, or strong beverage programs.
Highlights where product knowledge is weak, guiding training on menu items, allergens, and pairings.
Shows that you value informed recommendations, not just fast service.
Full-service brands where visible leadership presence matters for guest reassurance and problem-solving.
Indicates whether leadership coverage is sufficient during peak periods and links to recovery success.
Suggests a culture of accountability—someone is “in charge” and accessible.
Dine-in and quick-service locations with significant allergy risk or customization.
Tracks consistency of allergy protocols and helps reduce risk incidents at specific locations or times.
Guests with dietary needs will see this as a big trust signal; others may simply view it as professional.
Any concept emphasizing hospitality as a differentiator, from casual dining to fast casual.
Provides a graded view of service warmth, not just a Yes/No, so you can see if locations are “fine” vs “exceptional.”
Gives them room to say “okay but not amazing,” which is often more honest than a binary choice.
Full-service and casual dining brands that run daily or seasonal specials and want to track whether servers consistently talk about them.
Shows how reliably specials are mentioned by location, shift, or server team, so you can link specials awareness to attach rates, check averages, and menu performance.
Feels like a natural service question; guests understand specials are optional but appreciate being asked whether they were informed.
High-volume quick-service and fast casual concepts where line speed is central to the promise.
Flags speed-of-service issues by time of day and location, allowing you to adjust staffing or line design.
Simple and fair; guests know whether their wait felt reasonable.
Any brand that offers customization, substitutions, or builds (bowls, burgers, pizzas, etc.).
Pinpoints locations or channels with high error rates, which you can link to remake costs and refunds.
Shows that you understand accuracy is table stakes, especially for guests with strong preferences or dietary needs.
Takeout and curbside programs promising specific pick-up times.
Measures promise-time reliability and helps you adjust prep times, order throttling, and staffing.
Reinforces that their time matters and that “ready when we said” is part of your commitment.
Any format where wait times can vary significantly (busy lunch, weekend brunch, drive-thru).
Adds nuance beyond a Yes/No, helping you understand whether speed is a mild annoyance or a major pain point.
Gives guests a simple way to say “a bit slow” without feeling like they’re over-complaining.
Delivery and collection with mixed-temperature items.
Reveals whether packaging standards are consistently followed.
Signals care about food quality arriving as intended.
Brands with strong visual identity.
Tracks the gap between marketing imagery and delivery reality.
Acknowledges that presentation still matters off‑prem.
All off‑premise orders.
Identifies packaging weaknesses.
Reinforces packaging as part of the experience.
Apps, websites, kiosks, and third‑party platforms.
Comparable metric across channels.
Encourages reflection beyond just the food.
Curbside, drive‑up, and in‑store pickup.
Highlights friction in pickup logistics.
Signals pickup logistics are part of the overall experience.
Kiosk-heavy formats, fast casual concepts, or brands testing new ordering flows.
Evaluates digital tools vs traditional ordering methods.
Shows openness to feedback on technology.
Unconventional service formats.
Identifies signage or staff explanation gaps.
Acknowledges the format may be new to guests.
Growth brands expanding into new markets or channels.
Distinguishes new guests from existing fans and links awareness to experience scores.
Feels like a soft, non-intrusive way to understand their relationship with the brand.
Brands investing heavily in social content or promotions.
Helps estimate the overlap between social audiences and in-store or delivery customers.
Often feels casual and modern, especially to younger guests.
Brands with an app or points-based loyalty scheme.
Allows you to compare satisfaction and repeat intent between members and non-members.
Gently prompts non-members to think about joining without a hard sell.
Concepts wanting to understand first-time vs repeat guest behavior.
Splits results into “new” and “returning” segments so you can see who is more satisfied and why.
Easy to answer and helps them feel recognized as either a new or regular guest.
All concepts and channels as a simple catch-all improvement prompt.
Surfaces recurring themes you may not have written a structured question for; can be tagged and quantified over time.
Feels constructive and focused—it invites one key suggestion rather than a long rant.
Giving space for praise, unique situations, or details that structured questions miss.
Captures edge cases, standout team moments, and emerging issues; often a rich source of quotes and stories.
Shows that you’re open to whatever they want to share, not just what you decided to ask.