Out of the Box: February 2025
In This Issue:
- The Big Picture: Sales and Traffic Trends
- February 2025 Restaurant Industry Performance Trends In Detail
- Segment Focus QSR: Current Performance Trends
Out of the Box: February 2025
In This Issue:
- The Big Picture: Sales and Traffic Trends
- February 2025 Restaurant Industry Performance Trends In Detail
- Segment Focus QSR: Current Performance Trends

Out of the Box: February 2025
In This Issue:
- The Big Picture: Sales and Traffic Trends
- February 2025 Restaurant Industry Performance Trends In Detail
- Segment Focus QSR: Current Performance Trends
February 2025 Restaurant Industry Trends
The Big Picture: Sales and Traffic Trends
Restaurant performance in early 2025 is shaping up to be a tale of contrast, confusion, and caution.
From Fine Dining leading the pack, but also likely being a statistical mirage— to weather continuously influencing performance…
It can be easy to get lost in data.
However, beneath the seasonal noise? Black Box Intelligence sees a more concerning trend:
A softening in sales and traffic that mirrors a drop in consumer confidence.
Still, there’s a silver lining—staffing challenges are finally easing, with turnover at full-service restaurants hitting pre-pandemic lows.
So, is the industry slowing down or just catching its breath? Let’s dig into the February 2025 restaurant industry trends data and uncover the real story.
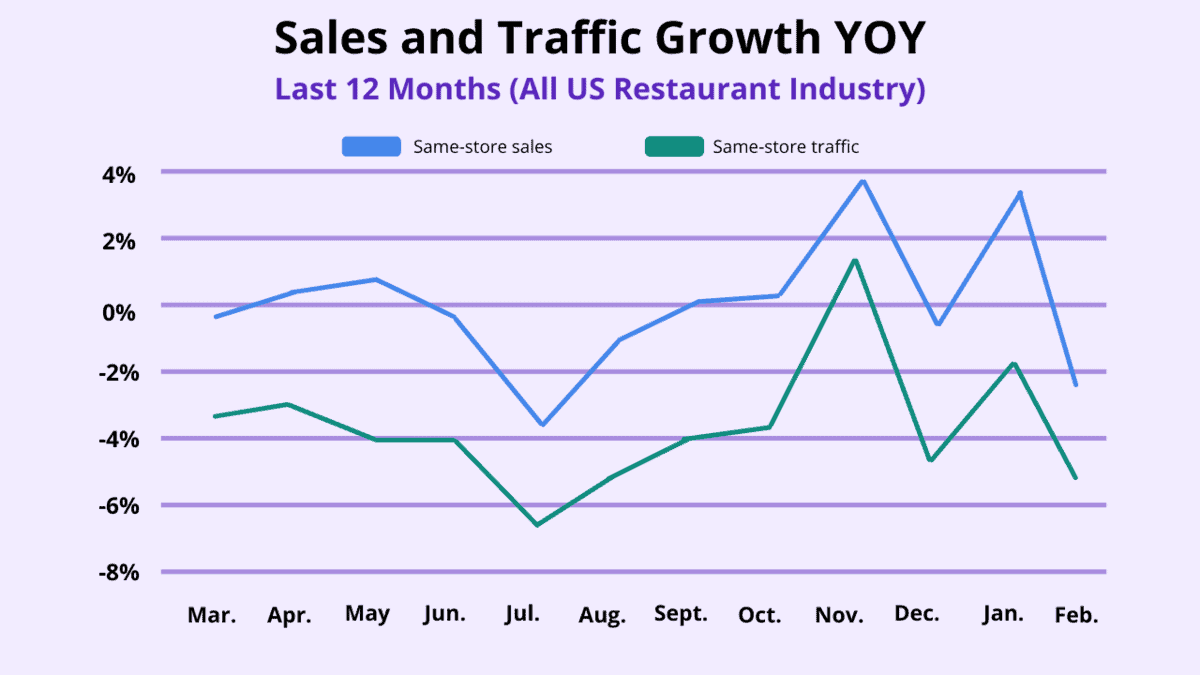
| Month | Mar. ’24 | Apr. ’24 | May ’24 | Jun. ’24 | Jul. ’24 | Aug. ’24 | Sept. ’24 | Oct. ’24 | Nov. ’24 | Dec. ’24 | Jan. | Feb. |
|---|---|---|---|---|---|---|---|---|---|---|---|---|
| Comp. Sales | +0.1% | +0.6% | +0.4% | -0.1% | -2.3% | -0.4% | +0.4% | +0.5% | +2.8% | -0.3% | +2.5% | -2.5% |
| Comp. Traffic | -2.2% | -2.3% | -3.1% | -2.8% | -4.6% | -3.6% | -2.7% | -2.5% | +0.9% | -3.2% | -1.3% | -5.7% |
February 2025
Restaurant Industry Trends In Detail
Every Month Black Box Intelligence releases the latest data in our Out of the Box to give a Big Picture view of the industry. But we want to dive deeper into the what’s happening in the “now” to project what the industry can expect in the future.
Deep Dive: Segment Performance
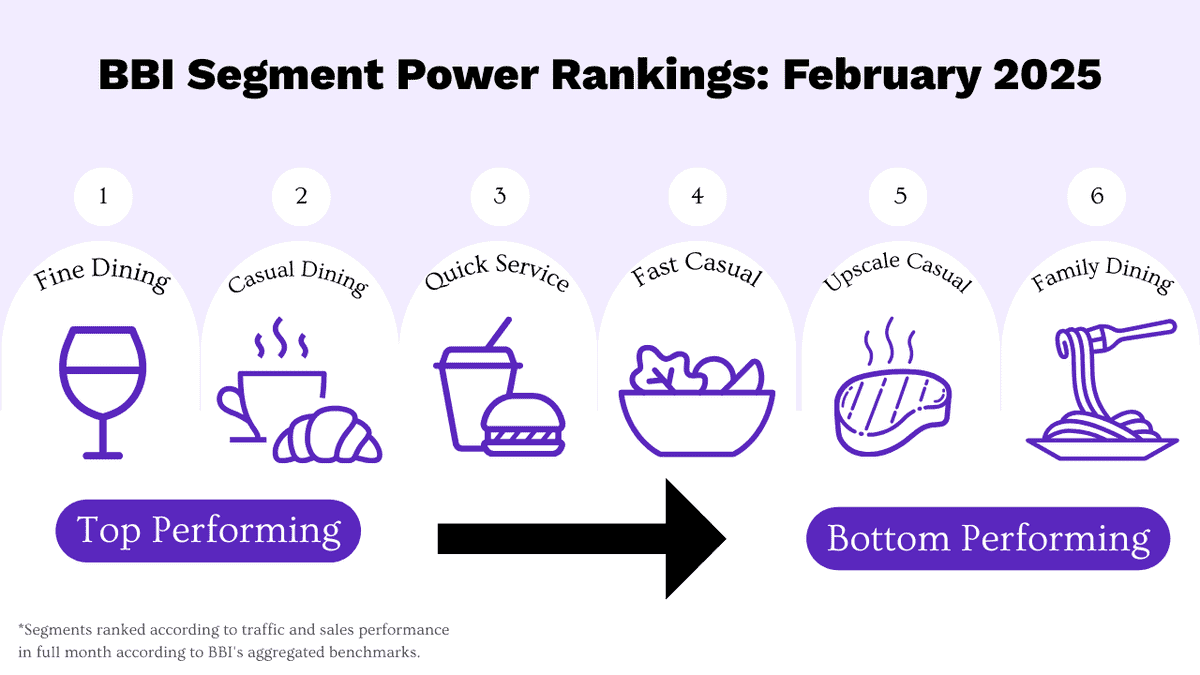
All industry segments experienced negative same-store sales growth during February. Consumer sentiment continues to center around income levels. Higher-income consumers are more likely to feel optimistic than their lower-income counterparts.
You might think this is the primary driver behind fine dining’s top performance based on YOY same-store sales growth. However, the reality? Their results were greatly helped by the overlap of an extremely bad February of 2024. When calculating same-store sales growth compared with February 2023, fine dining is performing near the bottom of the industry. It was only second to family dining.
Meanwhile, family dining has had the lowest sales growth during four of the last seven months. The segment has high check growth, driven by price increases, which have hindered traffic growth.
Best vs Worst: Location [YOY same-store sales growth]
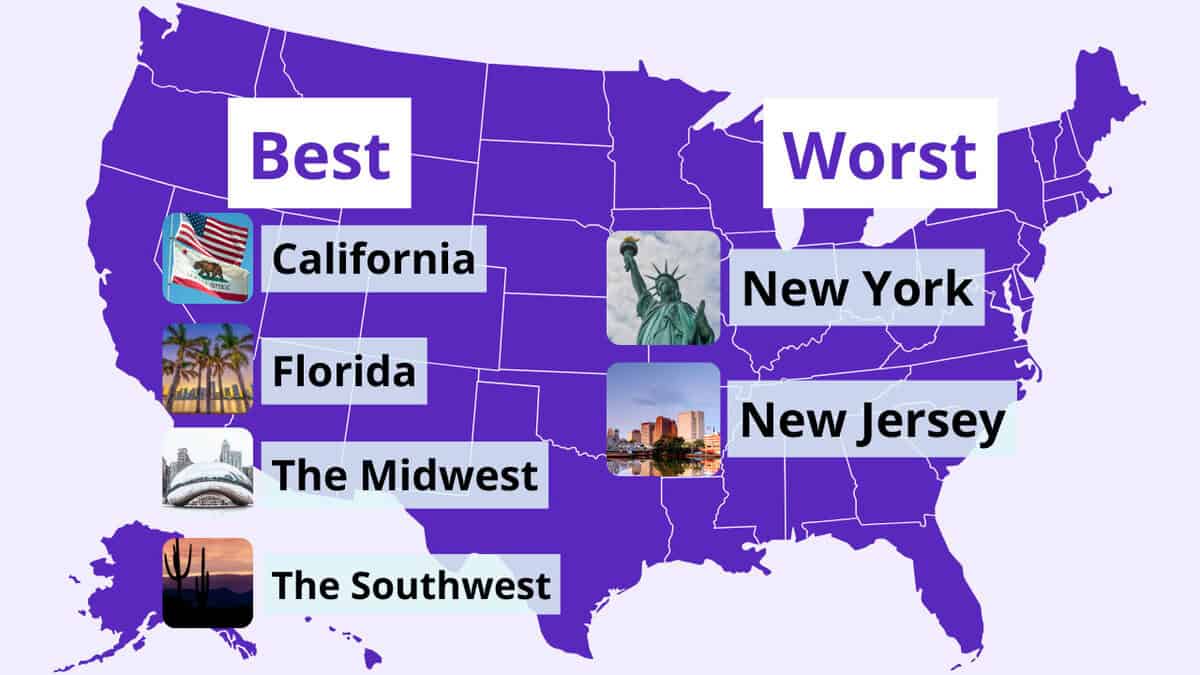
Unsurprisingly, weather during winter months has the most significant impact on restaurant performance. Given the cold temperatures this February, the country’s best performers had milder winters.
On the contrary, the region with the softest sales growth during the month was New York-New Jersey. They experienced much higher levels of winter precipitation than normal this year. Additionally, they had a very warm comparable period in February of 2024.
Segment Focus
QSR: Current Performance Trends
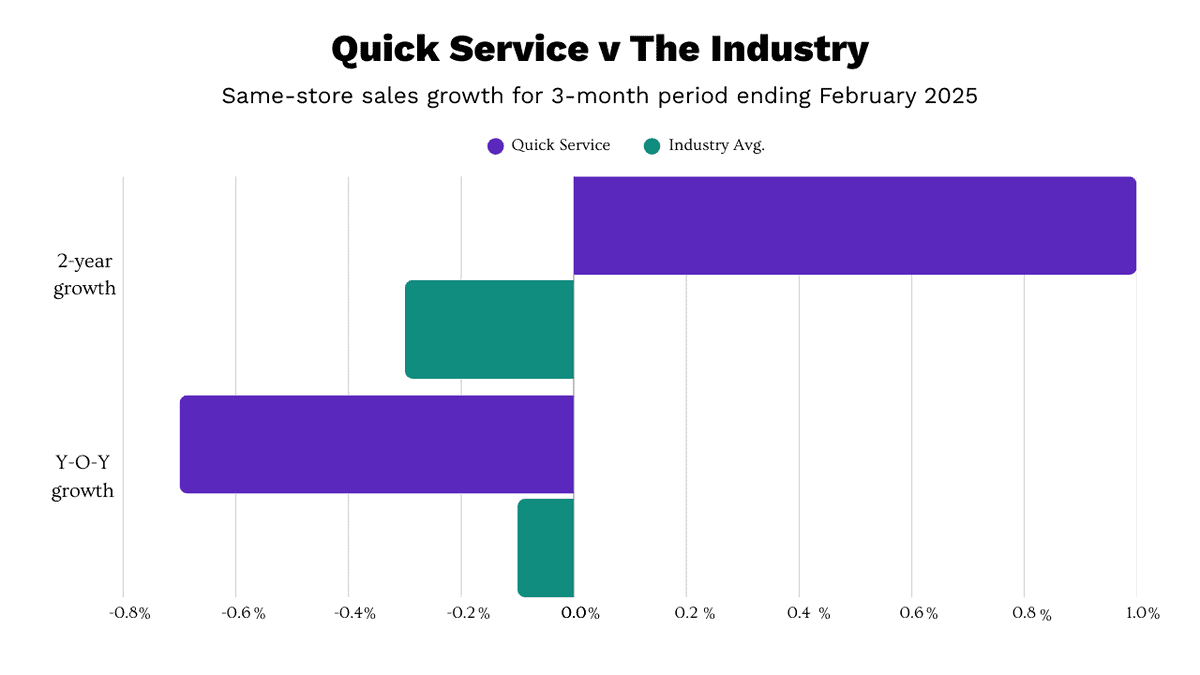
Quick service has consistently been among the top-performing segments in recent years.
| Same-store sales growth = -0.7% |
|---|
| (Dec 2024–Feb 2025 vs. Dec 2023-Feb 2024) |
In fact, it was the top-performing segment in 2024 based on same-store sales growth. Additionally, one of only two segments that was able to achieve positive YOY sales growth during the year (fast casual was the other). But now, quick service is paying the price of that strong performance a year ago.
Same-store sales growth for the last three months (December 2024 through February 2025) was -0.7% compared with the same period a year ago. This places quick service among the bottom two performing segments during the period. However, stepping back and calculating same-store sales growth over a 2-year period provides a much different picture.
Quick Service posted positive 2-year growth and remains a top performer in the industry. Put plainly, the segment is now lapping over the strong performance a year ago.
This makes their YOY growth rates look relatively poor, but they continue to be a strong performer in the long run.
Staffing, Workforce and Employment Focus Full Service Restaurants: Turnover Trends
| Hourly, Non-Management Turnover |
|---|
| Down 12 percentage points YOY |
| Down 3 percentage points QOQ |
| (Based on rolling 12-month turnover rates) |
Despite all the challenges faced by the industry, there’s one area that has seen some relief over the last year: staffing.
Turnover rates for hourly, non-management declined steadily throughout 2024.
And it’s currently lower than its pre-pandemic levels.
Preliminary numbers for Q1 2025 show that rolling 12-month turnover for hourly, non-management employees in Full Service restaurants is currently 12 percentage points lower than in the same quarter a year ago.
Turnover is dropping by three percentage points compared to the last quarter of 2024. This is very welcome news for restaurants. This is not only because of the significant costs associated with turnover (according to BBI research).
It costs upwards of $2,300 to replace a single hourly, non-management employee). It’s also because of the impact employee retention has on restaurant execution. Studies show that restaurants with lower turnover rates tend to have more positive guest sentiment related to their food, service, and cleanliness.
BBI Says
There is a lot of noise in the data so far this year. But, it is clear that January was much better than expected. Meanwhile, February was very disappointing. And despite the fact that weather has been a driving force behind some of the extreme results we’ve seen recently, there seems to be some underlying deceleration in restaurant sales and traffic that mirrors the declining optimism that the consumer is feeling.
“Uncertainty is definitely not good for the economy, and right now there seems to be a lot of uncertainty”, comments Victor Fernandez, Chief Insights Officer for Black Box Intelligence.
“The good news is early numbers from March suggest that the very weak February performance was an anomaly and not a true reflection of weakness for the industry. But with consumer confidence falling rapidly, especially the forward looking expectations on the economy and inflation, some softening in the industry’s performance is to be expected. Preliminary results for Q1 are already showing a deceleration in sales and traffic relative to what we saw in Q4 of 2024.”

Conclusion
The Restaurant Industry Trends from February 2025 tell a complex story.
Right now? It’s marked by harsh winter weather, shifting consumer sentiment, and a reminder that year-over-year comparisons don’t always reflect the full picture.
More encouragingly, however, years of staffing woes plaguing the industry finally are beginning to ease.
As restaurants move further into 2025, they should stay grounded in both short- and long-term performance trends.
Track how consumer confidence continues to evolve.
And stay up-to-date using resources like our Out of the Box and our Quarterly State of the Industry to navigate what’s next for 2025.
For Deeper Analysis
Quarterly SOTI Webinars
Our Out of the Box Monthly Updates provide high level trend analysis. We go into way more detail in our flagship quarterly State of the Industry (SOTI) webinar – our definitive take on the latest developments and a must attend for anyone in the restaurant industry.