The Restaurant Performance Network Advantage
Operator-Powered and Market-Proven
Go beyond internal reporting – tap into the most trusted network of restaurant benchmarks for clarity, context, and confidence.
30+ Years Serving the Biggest Names in the Restaurant Industry


Defining the RPN
What Is the Restaurant Performance Network (RPN)?
Built over 30+ years and started by restaurateurs due to a critical need they identified, the Restaurant Performance Network is the largest and most reliable data engine dedicated to our industry.
-
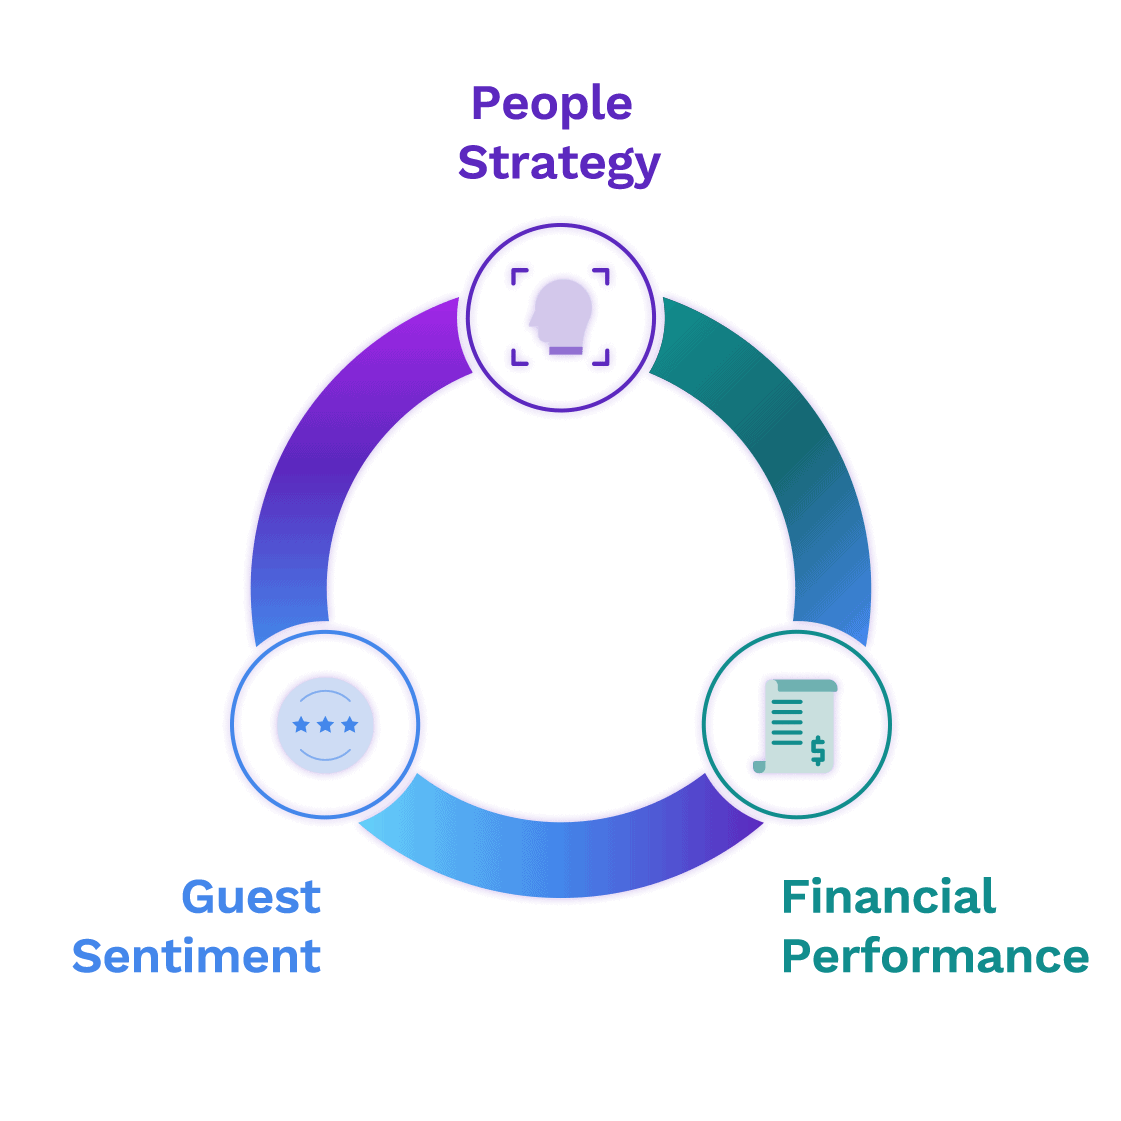
Broad Purview: Connects and includes extensive financial, workforce, and guest experience insights.
-
Join the Club: Join leading brands who are powering smarter performance strategies with shared data and rich benchmarks.
-
Deep Cross-Functional Impact: The RPN connects staffing and compensation metrics to guest satisfaction and sales outcomes.
BBI Customer Perspective
“Correlating the financial data with the workforce and guest sentiment data tells us a very clean story of where we are and where we need to get to.”
Brad Jacobus, CMO – Jim ‘N Nicks

Difference Makers
What Makes the RPN Unique?


“BBI is the only platform that is like comparing apples with apples. I honestly live and die by the data.”
Arlene Estrada Petokas – Chief People Officer, Kura Sushi USA

 Context
Market Or You?

-
Compare against relevant peer sets to understand whether performance trends are systemic or brand-specific
-
Answer the questions that matter: Is your NPS sliding because of a staffing gap? Is sales stagnant because of a market slowdown – or your execution?
Restaurant Centricity

-
100s of KPIs across sales, traffic, labor, guest sentiment, turnover, compensation, and operations.
-
Benchmarks drilldowns by brand type, region, segment, food style, chosen competitor set, day part, guest sentiment driver, NPS, Average Star Rating, turnover, compensation etc.
 Diagnose
Smarter Decisions

-
Get to root cause and size issue faster. Is it specific to a location or a having a much bigger impact?
-
Promote alignment across teams—marketing, HR, operations, and finance—by showing the real staffing, guest experience, and financial tradeoffs in one system.
BBI Customer Perspective
“An a-ha moment for us was just how much EVERYONE gravitated to the BBI data – from leadership and the field to the owners.”
Fasika Melaku, Vice President, HR and Chief Learning Officer – Denny’s

More Reasons Top Brands Partner with Us
Why BBI


Ready to Take the Next Step?
Leave your contact details and we’ll be in touch.