August 2025 Monthly Second Helping: Highlighting Hot Topics in the Industry
What BBI Data Says About Younger Generations’ Restaurant Spend
The kids are not alright – financially speaking.
This is according to a whole range of recently published studies and research.
The latest Household Debt and Credit release from the New York Federal Reserve reports that Americans’ personal debt has more than doubled from its levels 20 years ago.
The same report also shows repayment delinquencies are now back to pre-pandemic levels particularly for student loan debt (the repayment pause ended in September 2023 and missed payments that weren’t reported during this period started appearing on credit scores in 2025).
While this troubling data is unfortunately true among all generations, given the younger cohorts’ lower income levels and share of wealth, Millennials and Gen Z may feel the financial pain more sharply and may start pulling back their consumer spending at higher rates.
A recent Black Box Intelligence study suggests that younger people are already pulling back their restaurant spending.
Generational Challenges
According to the Federal Reserve, Millennials hold under 10% of the Nation’s wealth despite being 22% of the population. And in a recent Harvard survey, 42% of Americans under 30 (the majority of Gen Z) say they’re “barely getting by.”
There are many factors as to why younger generations are carrying this financial burden, including – but not limited to – significant student loan debt, entering the workforce during difficult economic periods (the Great Recession for millennials and the pandemic for Gen Z) and wages not keeping pace with the rising cost of living.
Additionally, younger people have less “good debt”-like mortgages. Millennials own homes at a lower rate than previous generations at a similar age. And given the rising cost of housing and high mortgage rates, Gen Z is expected to own at an even even lower rate.
Young Generations Pulling Back Their Restaurant Spending?
But how – if at all – is this affecting the restaurant industry?
Despite these hardships, younger people tend to allocate a larger share of their spending to food away from home.
While older generations lecture that this type of spending is a source of the younger generations financial struggles (see the famous Avocado Toast Debate). Younger generations however, retort that this is merely a consequence of their economic realities, valuing simpler pleasures in place of the less attainable traditional ones like homeownership.
Black Box Intelligence opts not to get involved in this inter-generational bickering. But it can instead offer some evidence pointing to younger people pulling back on their restaurant spending. When we combine our restaurant performance dataset and demographic information from the United States Census, we can examine restaurant performance in younger zip codes.
By grouping zip codes where the estimated median age is under 32.7 (the youngest 10% of zip codes) we start to see patterns over the past two years.
Difference in Traffic Growth By Age: Last 18 Months
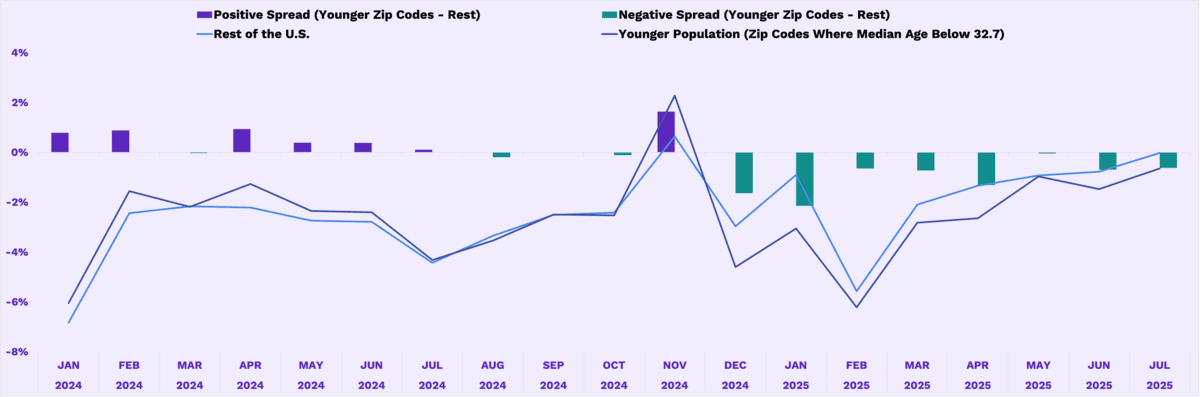
Source: Black Box Intelligence Restaurant Performance Network
There’s a lot going on in this chart so to explain, the two lines highlight the differences in the overall Y-on-Y traffic growth for that month between zip codes broken out by age (dark navy blue represents younger populations, whereas the the light blue represents the rest of the US). The bars represent the difference between these different groups, with purple highlighting months where the younger population zip codes have higher growth than the rest of the US, and green the opposite.
Bottom line: Younger populations had higher traffic growth than the general population in 2024, but this has shifted on its head in 2025.
To be more precise: in 2024, these “younger” zip codes tended to beat the rest in year-over-year traffic growth. From January to July of 2024, restaurants located in the younger zipcodes outperformed the rest by an average 0.5 percentage points.
However, this reversed in the latter months of the year (with the exception of November which saw very strong traffic growth throughout the industry due to a calendar shift for the Thanksgiving holiday). This negative trend carried into 2025, with restaurants in the younger zip codes underperforming the rest of the system in every month of this year so far (an average of –0.9%).
What to Expect Going Forward
Given the current economic uncertainties, particularly among younger groups, it is likely we will see these trends continue. As other generations age out, restaurant brands will need to appeal more to these more financially troubled generations. Perhaps a value offering of half-off avocado toast will do the trick.
What is the Monthly Second Helping?
Every month, BBI explores a topical trend impacting restaurant brands. As the gold standard of restaurant insights, our Restaurant Performance Network gives us the unique ability to get right to the bottom of all the hot topics impacting the industry.

Further Insights and Research
More from Black Box Intelligence
