The Restaurant Performance Platform
Everything You Need to Grow
Black Box Intelligence brings your data, insights, and teams together in one powerful platform built for restaurant performance.
From daily operations to long-term strategy, we give you the clarity, benchmarks, and action plans to move faster, fix problems, and outperform the market.
BBI Restaurant Performance Platform
Make Smarter Moves. See the Bigger Picture. Fix What’s Broken.
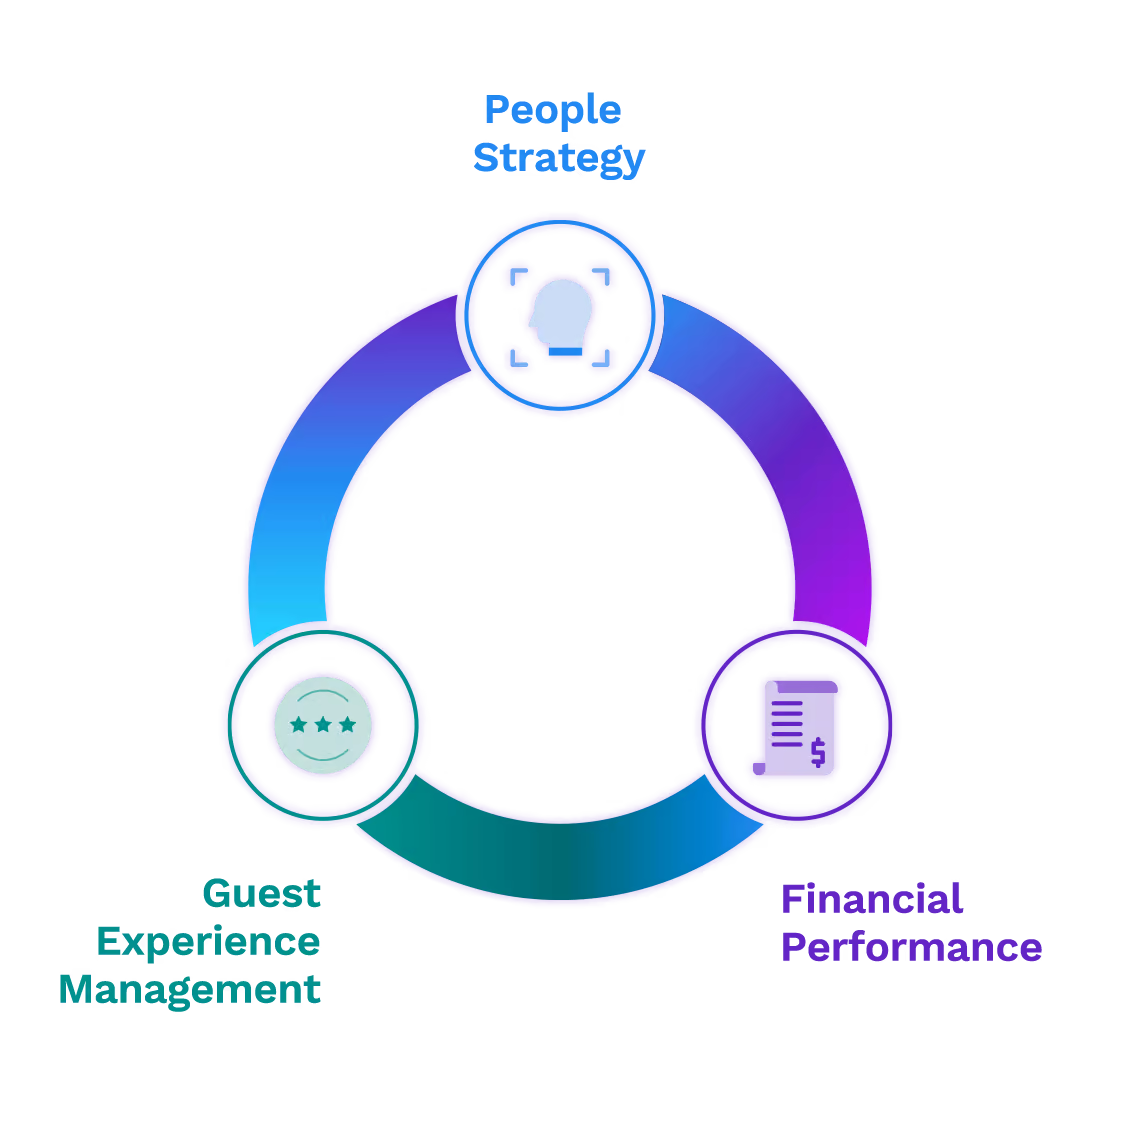
The BBI Restaurant Performance Platform connects every piece of your restaurant brand’s performance: guest experience, workforce stability, sales, traffic, and competitive positioning. With our platform, you don’t just track results — you understand what drives them.
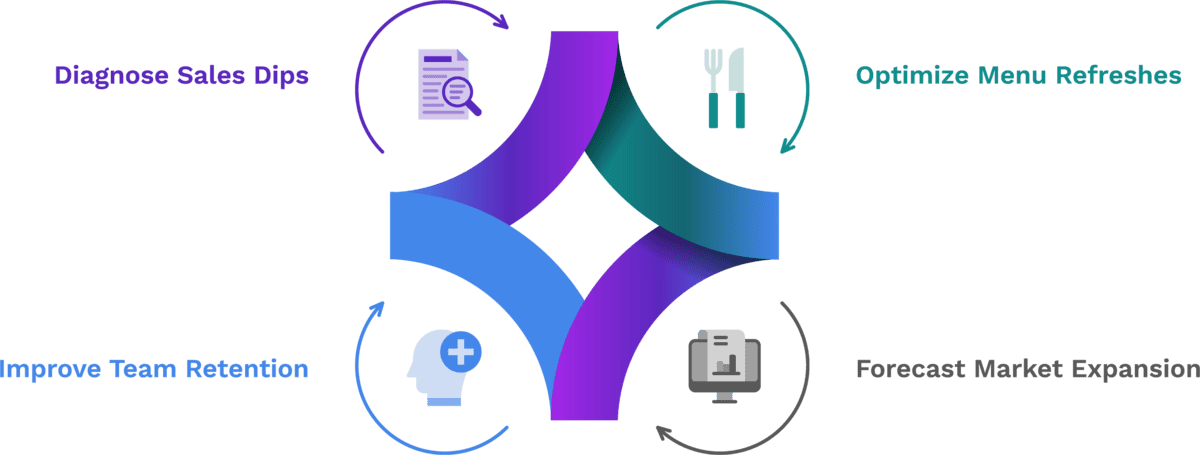
Performance Intelligence
The Restaurant AI Command Center
Get a real-time view of your brand’s performance. Performance Intelligence combines your guest, workforce, and financial data into one AI-powered command center.
Find every opportunity. Prioritize action with confidence.
Restaurant Performance Network
Is it the Market…or YOU?
Compare your performance to the industry’s largest and most trusted benchmarks. Sales. Traffic. Sentiment. Workforce.
The Restaurant Performance Network is your roadmap to better performance.
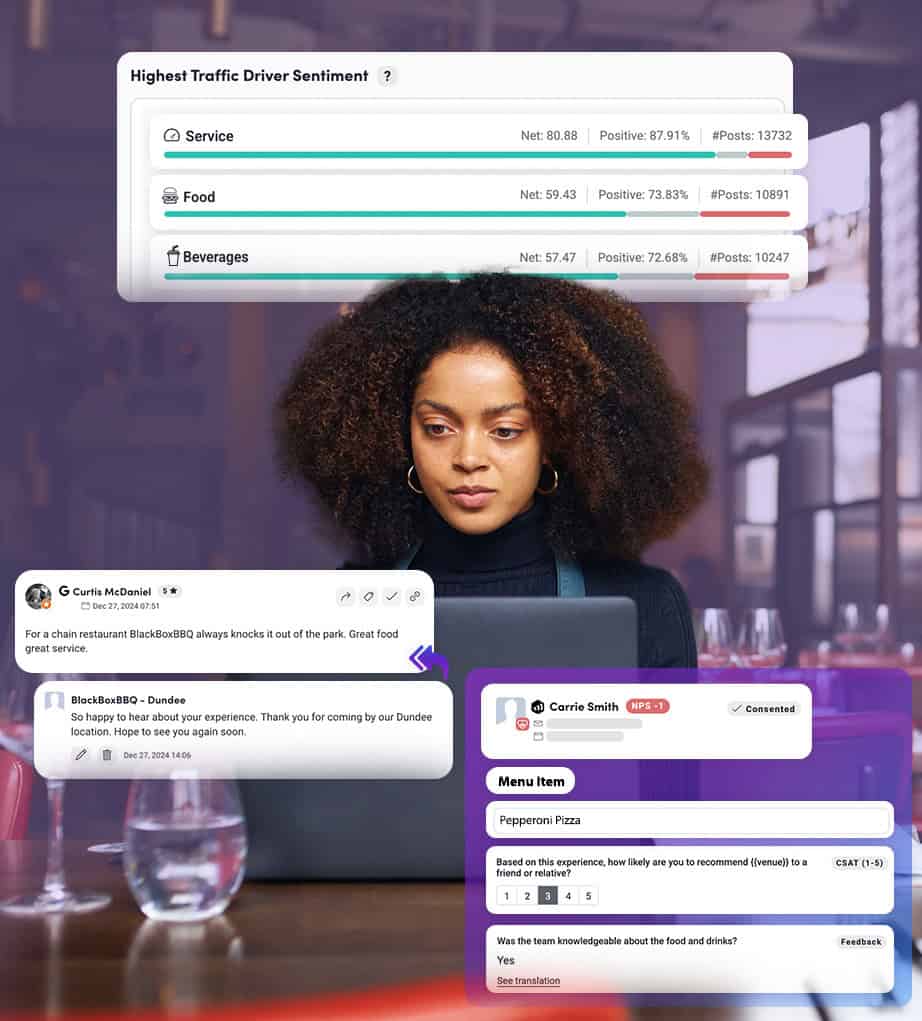
Guest Intelligence
Everything Guest Experience. One Platform.
Stop managing surveys, reviews, social, and feedback in silos. Guest Intelligence brings everything into one place so you can analyze, respond, and act at scale — powered by restaurant-trained AI.
Get Demo
Speak to Expert
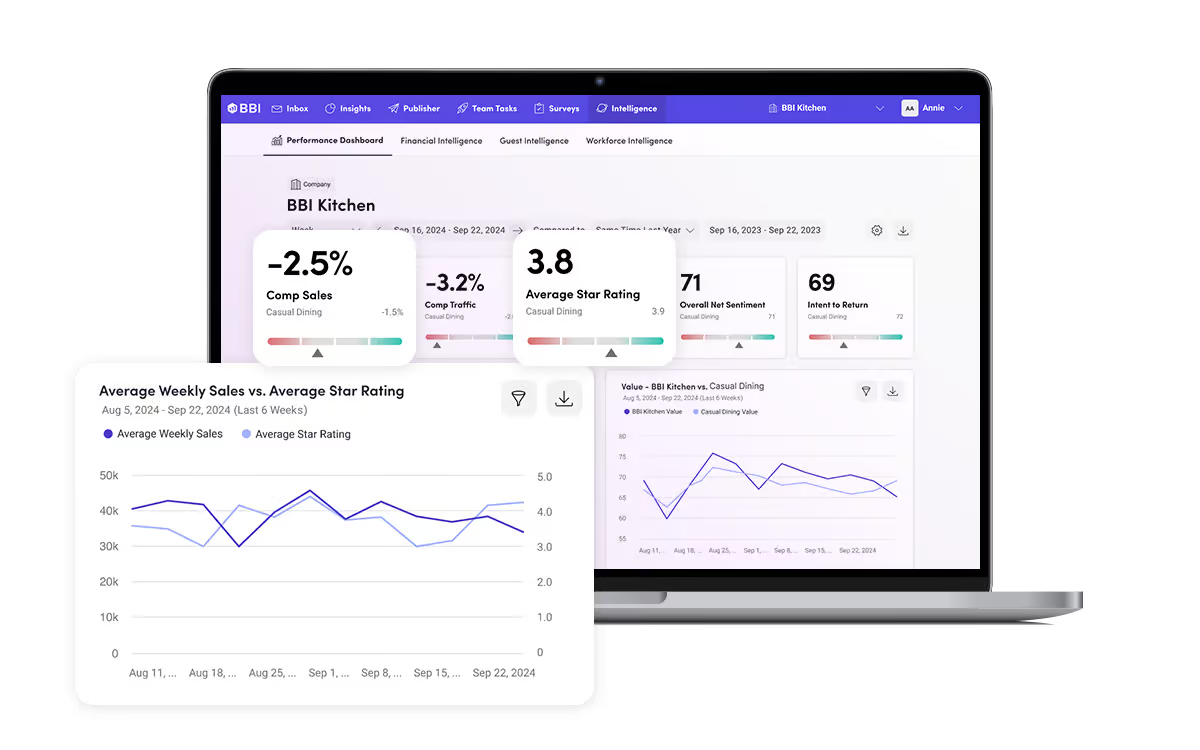
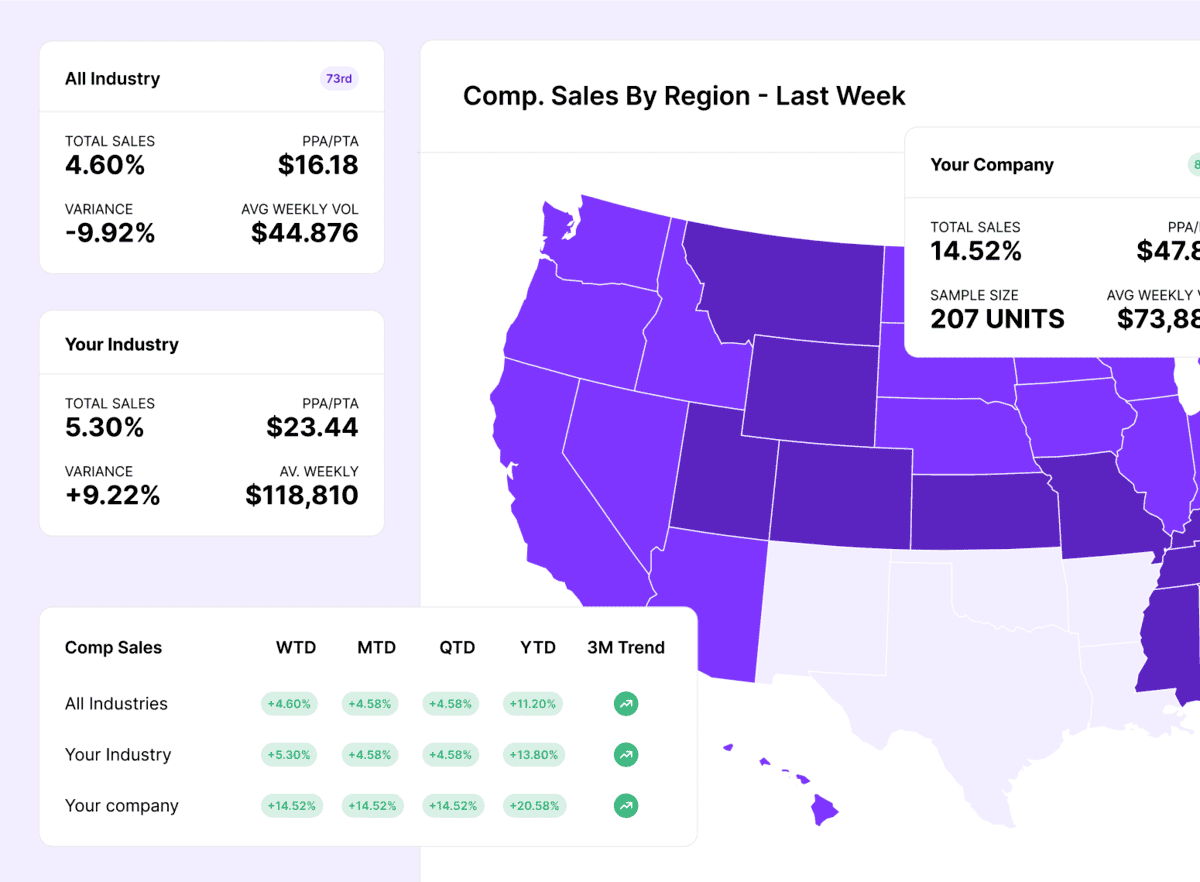
Financial Intelligence
Restaurant Sales & Traffic Benchmarks
Use gold standard industry benchmarks to see what’s driving your financial results. Know whether dips in sales, traffic, or margins are caused by internal issues or market-wide trends.
Make decisions with confidence.
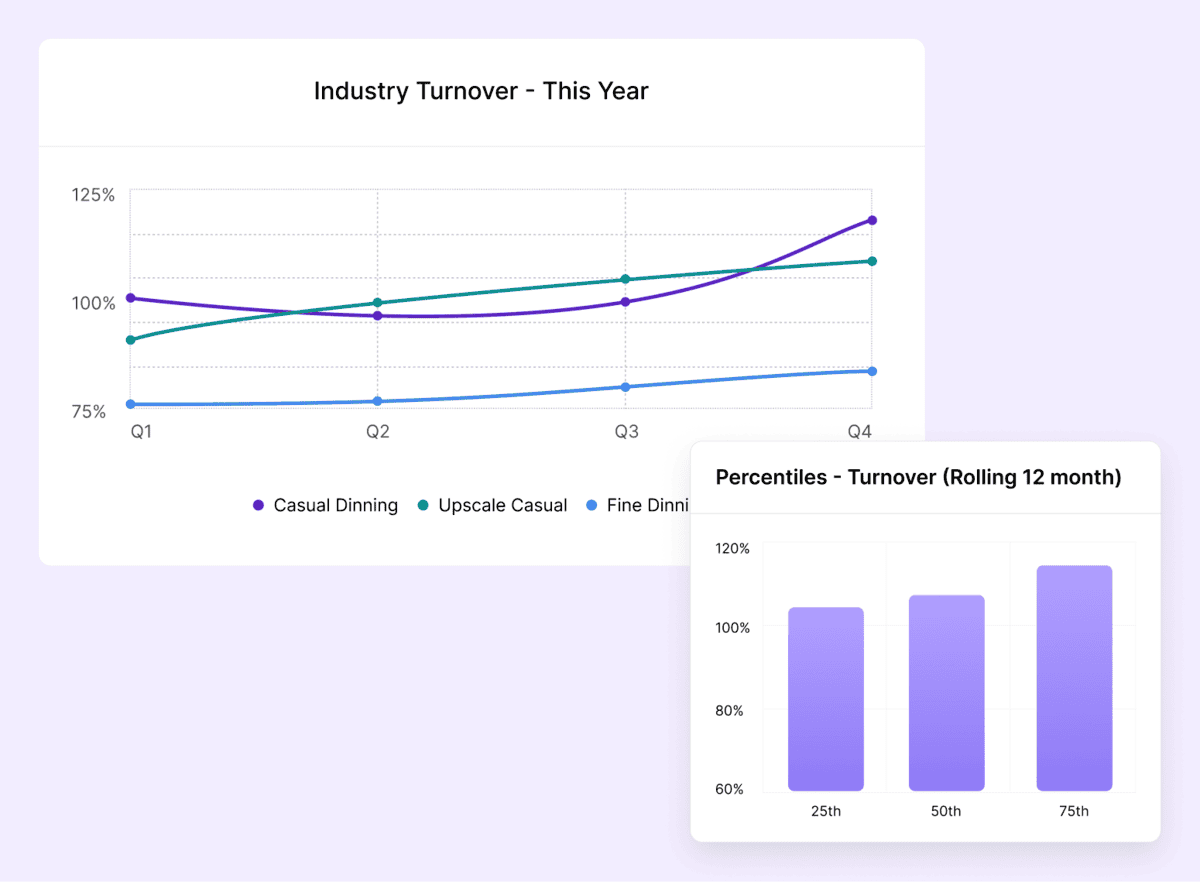
Workforce Intelligence
Restaurant Pay, Compensation and Turnover Benchmarks
Turnover, staffing, and training — all in one place. Track workforce trends, benchmark performance, and uncover what the best brands are doing to retain and empower their teams.
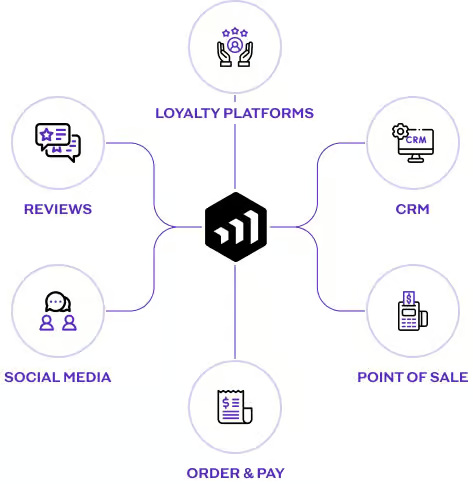
Integrations
Data In. Action Out.
Integrate with all your critical social media channels and tech platform for maximum convenience, optimal data exchange, and – in turn – insights.
Superior Restaurant Performance Management
Why Black Box Intelligence?
We’ve spent 30+ years partnering with the biggest names in the restaurant industry. That means we understand what really moves the needle — and we’ve built our platform to do exactly that.


Customer Testimonials
The Biggest Restaurant Brands Rely On Us To Get Better

BBI Customer Perspective
“Positive sales are the result of doing things right. Our BBI scorecards highlight exactly what is and isn’t working in which units.”
Roger Gondek, COO – Twin Peaks

BBI Customer Perspective
“Correlating the financial data with the workforce and guest sentiment data tells us a very clean story of where we are and where we need to get to.”
Brad Jacobus, CMO – Jim ‘N Nicks

BBI Customer Perspective
“Average Star Rating is a proven leading indicator of sales. BBI is great at letting us know where we are at but – more importantly – where we are going.”
Brooke Perry – VP Marketing, Velvet Taco

BBI Customer Perspective
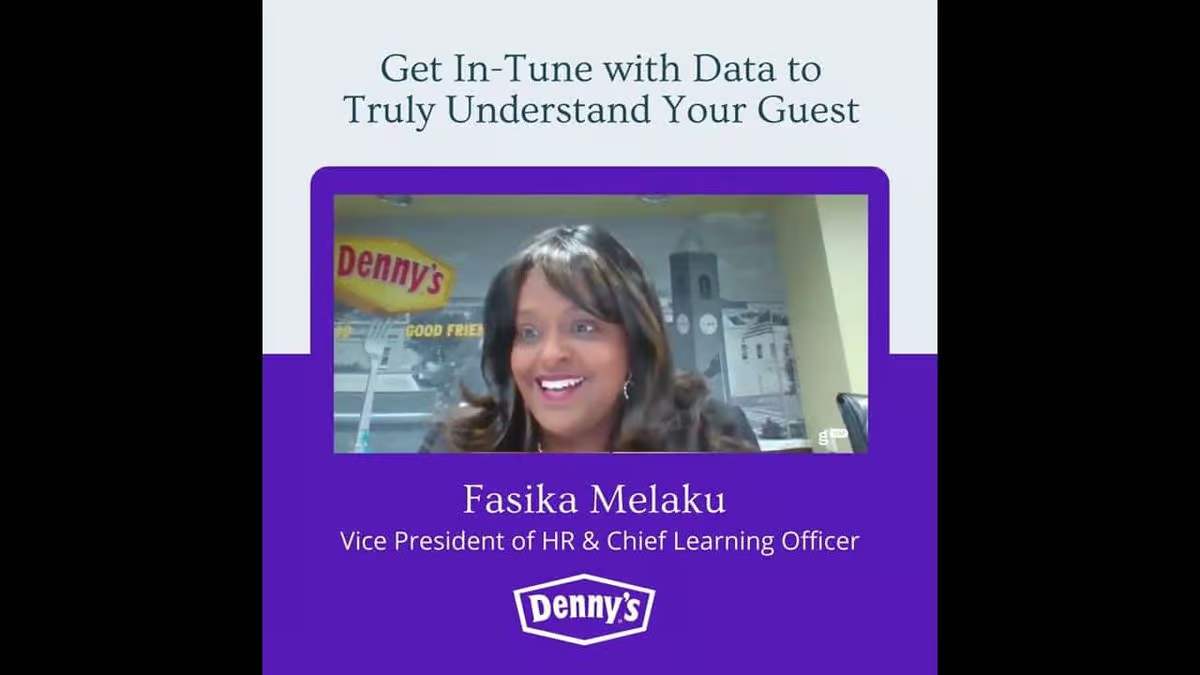
“An a-ha moment for us was just how much EVERYONE gravitated to the BBI data – from leadership and the field to the owners.”
Fasika Melaku, Vice President, HR and Chief Learning Officer – Denny’s
BBI Customer Perspective
“With over 1000 locations worldwide, we need to have a strong pulse on the brand experience. BBI’s solutions mean that the quality of service and value of our offerings are always aligned to the broader brand vision, regardless of region or franchise.”
Mike Woida, President International – CKE Restaurant Holdings, Inc.

BBI Customer Perspective
“BBI has helped improve our overall performance in same store sales and guest counts. They have pushed our operators to improve their performance.”
Mike Axiotis, President, Lehigh Valley Restaurant Group dba Red Robin


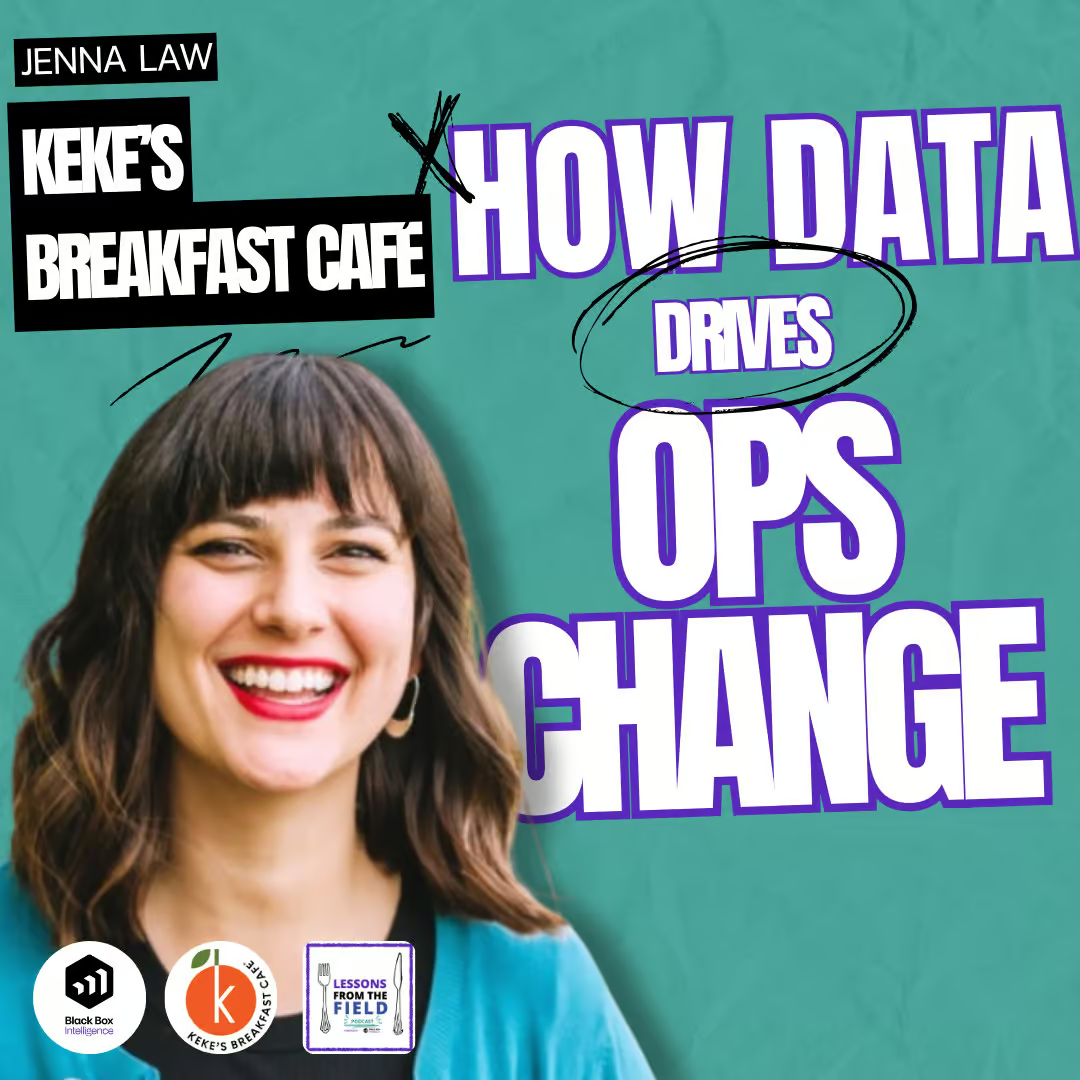
BBI Customer Perspective
“It’s very very clear that our top performing units for sales and growth are also our top performers for reviews – both in terms of quantity and quality of the feedback received.”
Jenna Law – Marketing Director, Keke’s Breakfast Cafe

Talk to us today!
Leave your contact details to learn more about the restaurant performance management platform and we’ll be in touch.