Monthly Restaurant Trends Review
Out of the Box: April 2025
-
Restaurant industry turns in a solid, though uneven, performance: same-store sales rose and its the second-strongest month of 2025 behind January.
-
Quick Service and Fast Casual were the only segments to slip into negative sales territory.
-
Regionally, two areas failed to post sales growth: California and the Western region.
-
Overall, April’s data suggests that, while industry demand is improving, tougher year-over-year hurdles and persistent economic pressures are ahead.

In This Issue:
-
The Big Picture: Sales and Traffic Trends
-
Segment Focus: Fast Casual
-
Staffing Turnover Review: Full Service
-
Future Projections
April 2025 Restaurant Industry Trends
The Big Picture: Sales and Traffic Trends
From a headline perspective, April was a relatively good month for restaurants.
This came despite the challenges faced since February.
These challenges include…
- increasingly weak consumer sentiment
- rising inflation expectations
- consumers, fearful of upcoming employment conditions in the next year.
So a tough economic environment – not just for restaurants but the majority of consumer-focused businesses.
Bottom line: Black Box Intelligence data shows same-store sales growth for the industry at 1.1% during April.
This represented an acceleration in sales growth compared to the previous month, when sales growth sat at 0.9%.
Additionally, it was the second consecutive month in which sales growth has been positive.
April was the second strongest month for the industry since the beginning of the year.
Only January had stronger same-store sales growth of 2.5%.
However, this could be largely attributed to favorable weather comparisons year over year).
Furthermore, same-store traffic growth was -1.5% during April, a significant acceleration from the -2.2% reported in March and also the best month for the industry since January.
However, it is important to temper some of the optimism from the results.
Q1 2024 was the weakest during the year based on sales and traffic growth.Relative comparisons year over year will only get harder to surpass from here. Meanwhile, economic pressures may also worsen.
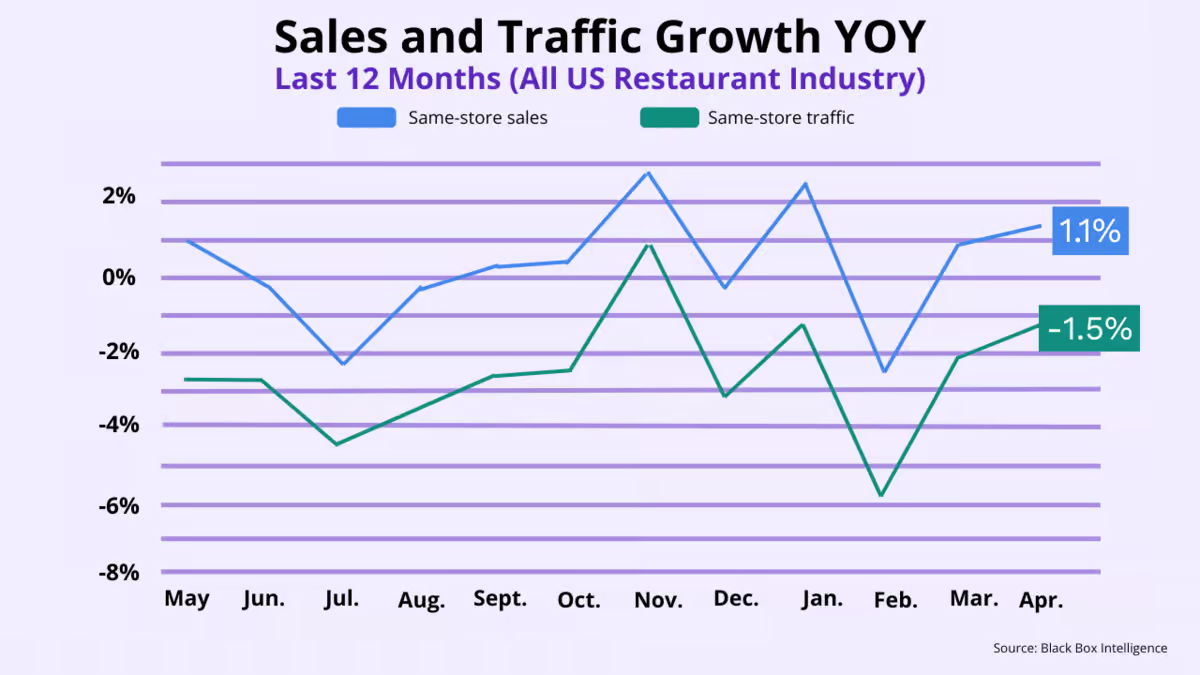
| Month | May ’24 | Jun. ’24 | Jul. ’24 | Aug. ’24 | Sept. ’24 | Oct. ’24 | Nov. ’24 | Dec. ’24 | Jan. | Feb. | Mar. | Apr. |
|---|---|---|---|---|---|---|---|---|---|---|---|---|
| Comp. Sales | +0.4% | -0.1% | -2.3% | -0.4% | +0.4% | +0.5% | +2.8% | -0.3% | +2.5% | -2.5% | 0.9% | 1.1% |
| Comp. Traffic | -3.1% | -2.8% | -4.6% | -3.6% | -2.7% | -2.5% | +0.9% | -3.2% | -1.3% | -5.7% | -2.2% | -1.5% |
Segment Overview
QSR and Fast Casual Lagging
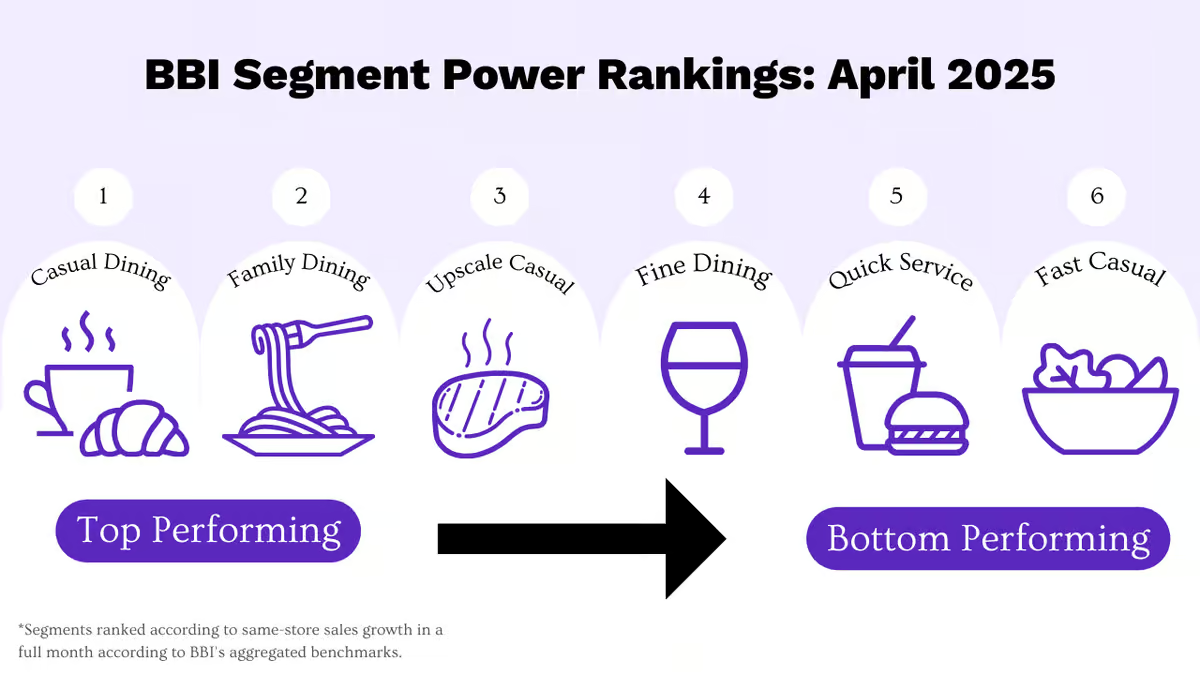
According to Black Box Intelligence data, only two segments experienced negative same-store sales growth during April: Quick Service and Fast Casual.
These two segments were among the weakest for traffic growth during the month.
This may be an indicator of consumers’ behavior due to economic pressures. Particularly, a signal that lower-income guests are going back to groceries instead of going out to eat.
Our analysis shows that restaurants in zip codes with the lowest household incomes experienced negative same-store sales growth in Q1 2025.
It also had the softest traffic growth. This indicates that the lowest income brackets are indeed cutting spending and restaurant visits.
Another factor behind the weak year-over-year results? They performed better than the rest of the industry a year ago: in other words, these segments were the only ones with positive growth in April of 2024.
And those stronger historic results have proven to be a hard hurdle to overcome in the context of year-over-year growth rates.
Conversely, Casual Dining continues to outperform the industry at large by a wide margin.
Brands in this category prove that the demand for their service style can remain significant – but at the right price to value perception.
Furthermore, they can capture a significant market share from neighboring brands and segments.
But not every brand in this segment is seeing the same strong performance.
In fact, less than a third of all Casual Dining chains tracked were able to achieve positive same-store sales growth during April.
Segment Focus Deep Dive
Current Performance Trends in Fast Casual
Overall, limited service restaurants performed better than full service restaurants over the last five years.
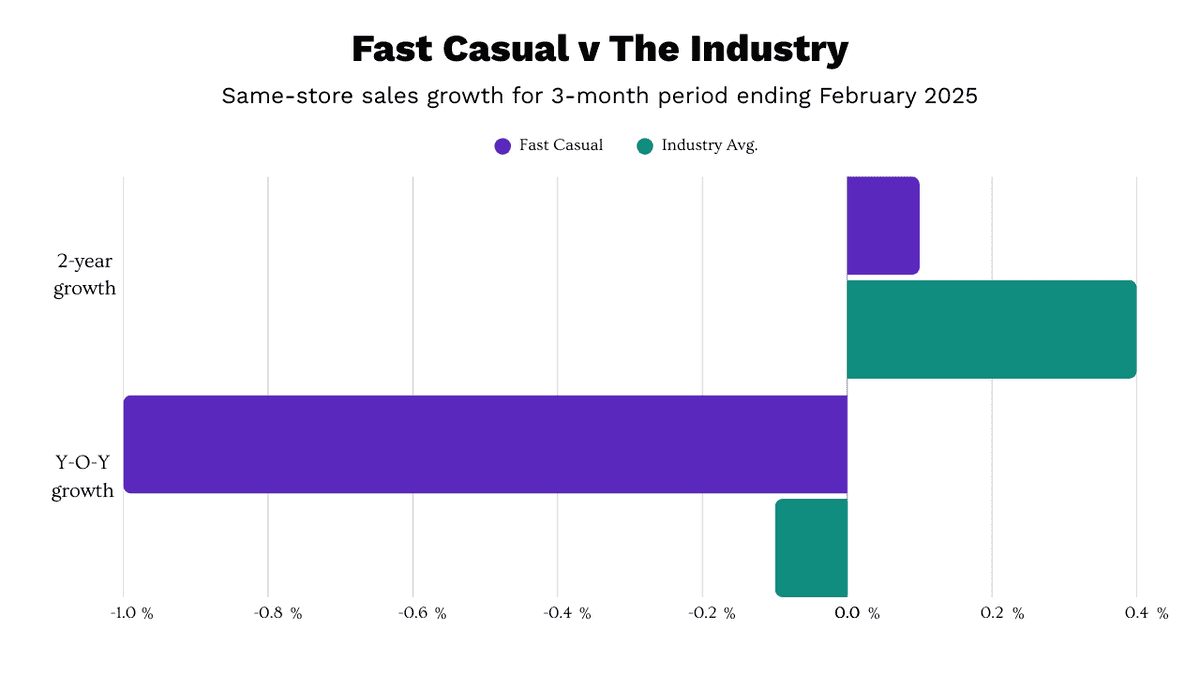
| Same-store sales growth = -1.0% |
|---|
| (Feb-Apr 2025 vs. Feb-Apr 2024) |
During the early part of the pandemic, they were simply more evolved and sophisticated. They were better prepared to operate in a largely off-premise world.
But later, when inflation began to skyrocket?
They also benefited from occupying lower prices. Thus, they captured the demand of guests who couldn’t afford to eat out at higher price points (or at least afford to do so as frequently).
Fast Casual has the best same-store traffic growth over the last five years.
When it comes to traffic, Fast Casual is the second-best segment based on same-store sales growth behind Quick Service.
And for the last three months, Fast Casual’s same-store sales growth was -1.0%.
This makes it the second-best performing segment, only behind Casual Dining.
Overall, Fast Casual has been able to grow same-store sales by 1.3% over the last two years.That is better than any full-service segment with the exception of Casual Dining.
One of the advantages that Fast Casual has had is much lower check growth than the rest of the industry, a position it has held for over two years.
Restaurant data continuously shows a tradeoff between check growth and traffic, so not surprisingly, Fast Casual has had the best traffic growth results in recent years.
Staffing, Workforce and Employment Focus
Current Turnover Trends in Limited Service Restaurants
| Full Service Restaurants, Management Turnover: |
|---|
| Down 2 percentage points YOY |
| Down 2 percentage points QOQ |
| (Based on rolling 12-month turnover rates) |
The major concern for employee retention in recent years has not been hourly, non-management employees. Yes, turnover for this category of employees continues to be higher than many would like. However, it has been decreasing every quarter. And by the third quarter of 2024? It had reached levels lower than pre-pandemic based on our data from 2019.
Turnover for those non-management employees has consistently dropped in this time.
Still, turnover for those within the management ranks (especially in full-service restaurants) proves to be more stubborn. It is not coming down at the same rate.
For this reason, it’s welcome news to see management turnover rates begin declining again. Turnover for managers in full-service remains higher than pre-pandemic. Yet, the levels we have seen in 2025 so far are the lowest in years.
This is particularly important given the correlation between management retention and overall performance.
Improved management retention means more stable teams. And, all of these factors are linked to better execution and stronger guest sentiment.
Victor Fernandez, Chief Insights Officer, On:
Tariff Impact
“This is the question we get asked the most. Even if there is little direct effect coming from them so far, the uncertainty they have created is enough to have significantly changed the consumer’s mindset.”
“If economic fears linger and – even worse – if the effect of tariffs materializes as an acceleration in inflation, a slowdown in restaurant sales and traffic is inevitable.”
“But consumers are indicating they want to continue to spend at restaurants: sales growth year over year continues to be positive and traffic is holding up better than in recent months. But at which brands and how often they can afford it may be changing soon.”
“We expect trade downs to resume at a larger scale from middle income consumers shifting down from Casual and Family Dining in response to inflationary pressures, favoring those brands in Quick Service and Fast Casual.”

Looking Ahead
Navigating an Uncertain Path
April 2025 restaurant industry trends show performance is seeing a minor, but much-needed lift.
With improving sales momentum and signs of recovery in traffic trends, all are good signs.
However, while these gains are encouraging, they come with important caveats.
One reason things looked better is that Q1 of 2025 was tough. That means it was easier to do better in April. Also, the weather helped some restaurants do well, but that won’t always be the case.
As we look to the months ahead, operators should brace for a more challenging landscape. Year-over-year comparisons will tighten.
Economic anxiety remains elevated. Inflationary pressures are building and are potentially exacerbated by new tariffs.
Additionally, there are concerns related to a pullback in international travel into the country. This means summer may see added challenges for restaurants operating in tourist destinations.
All of this could further shift consumer behavior. Already, we’re seeing signs of trade-down activity and reduced visits from lower-income guests.
Brands must remain agile by balancing value perception, operational execution, and guest experience.
Also, they should continue to monitor shifting sentiment and spending patterns closely.
Success will come to brands that adapt to the evolving demands.
Black Box Intelligence will continue to track trends and provide the insights leaders need to navigate 2025 and beyond.
For Deeper Analysis
Quarterly SOTI Webinars
We go into way more detail in our flagship quarterly State of the Industry (SOTI) webinar – our definitive take on the latest developments and a must attend for anyone in the restaurant industry.