Monthly Restaurant Trends Review
Out of the Box: May 2025
-
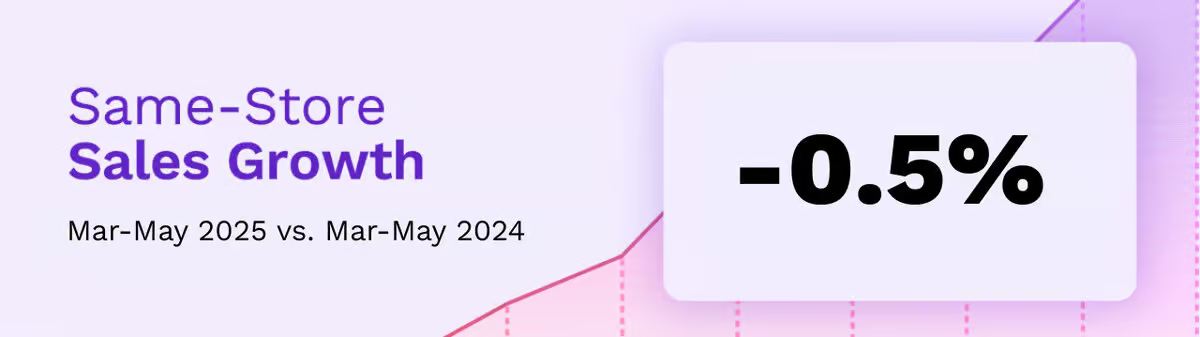
Same-store sales growth was 1.4% for chain restaurants in May
-
Casual Dining and Fast Casual show strength while Fine Dining remained the weakest
-
Sales trends revealed California and Texas lagging, while New England and the Midwest lead the industry
-
The Family Dining Segment is being severely impacted by inflation concerns
-
BBI data shows single manager turnover represents over $10,000 in hard costs for all levels of management, excluding General Managers

In This Issue:
-
The Big Picture: Sales and Traffic Trends
-
Segment Focus: Fine Dining
-
Best vs Worst: Region, Segment, and Cuisine
-
Staffing Turnover Review: Limited Service
May 2025 Restaurant Industry Trends
The Big Picture: Sales and Traffic Trends
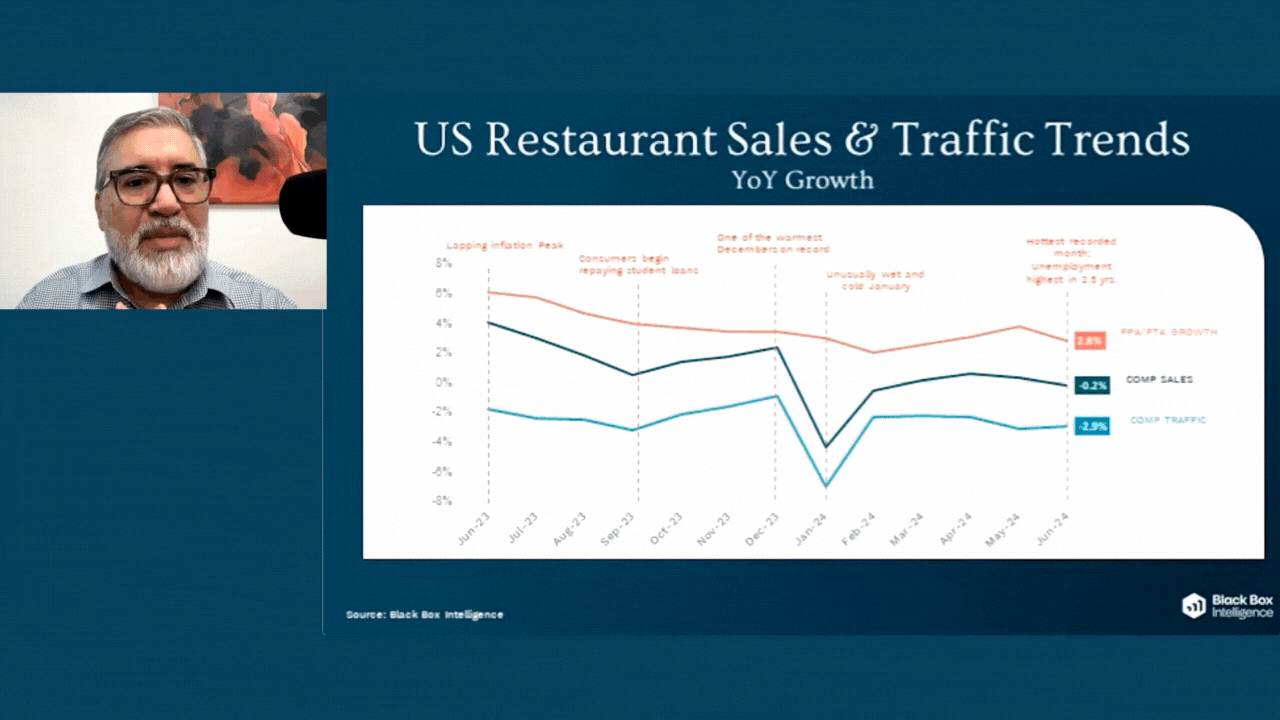
May was another relatively good month for chain restaurants based on same-store sales and traffic growth. Both growth rates accelerated during May.
Thus, May became the third consecutive month where year-over-year same-store sales and traffic growth improved. Over the last six months, only January achieved better sales growth.
This was arguably due to favorable weather conditions compared to the previous year.
In the case of traffic?
Excluding November of 2024, which was an outlier, the last time chains saw stronger same-store traffic growth was over two years ago. That was back in February of 2023.
These latest results defied expectations. Especially in the face of the rapidly eroding consumer optimism in recent months.
The University of Michigan’s Consumer Sentiment Index remained at its lowest level in May since July 2022. This is when consumers were contending with the highest inflation rates in over 40 years.
Same-store sales growth was 1.4% for chain restaurants in May, up 0.3 percentage points from April’s growth rate. Same-store traffic growth was -1.0%. This represented an acceleration of 0.6 percentage points relative to the previous month’s year-over-year growth rate.
However, closer analysis reveals that there are still brands struggling in this environment. And upon reviewing May 2025 restaurant industry trends, it’s especially the case at the industry segment level.
| Month | Jun. ’24 | Jul. ’24 | Aug. ’24 | Sept. ’24 | Oct. ’24 | Nov. ’24 | Dec. ’24 | Jan. | Feb. | Mar. | Apr. | May |
|---|---|---|---|---|---|---|---|---|---|---|---|---|
| Comp. Sales | -0.1% | -2.3% | -0.4% | +0.4% | +0.5% | +2.8% | -0.3% | +2.5% | -2.5% | +0.9% | +1.1% | +1.4% |
| Comp. Traffic | -2.8% | -4.6% | -3.6% | -2.7% | -2.5% | +0.9% | -3.2% | -1.3% | -5.7% | -2.2% | -1.5% | -1.0% |
Segment Overview
Who’s Up and Who’s Down Across the U.S.
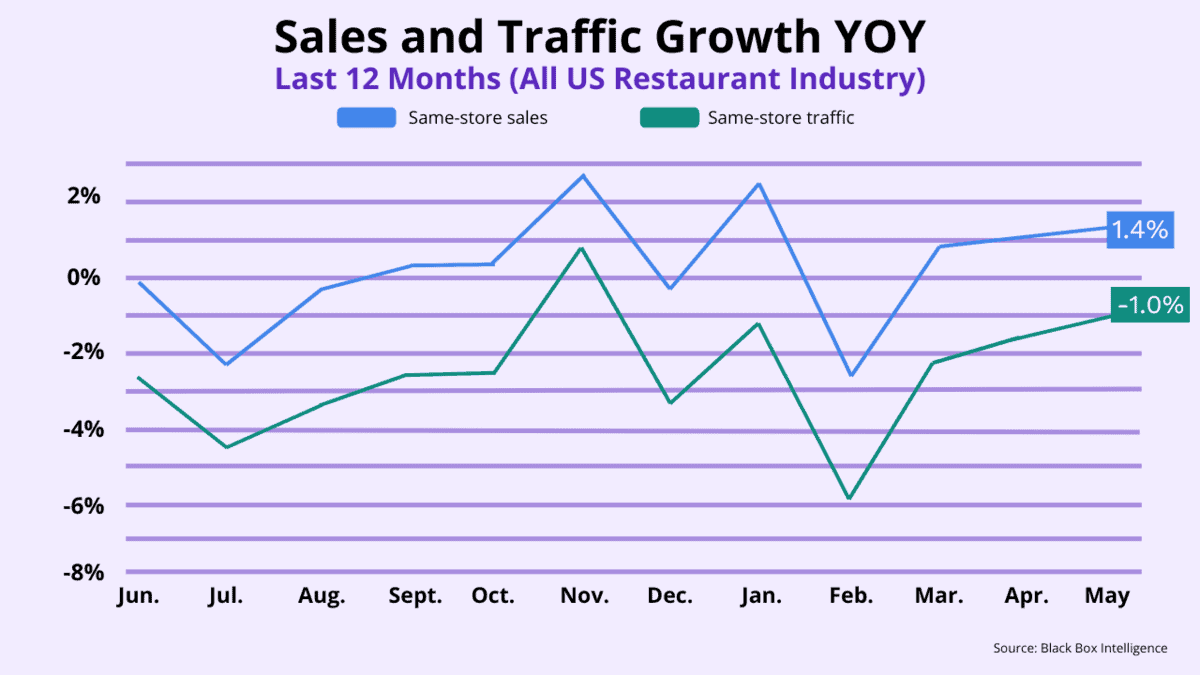
Only two industry segments achieved strong positive same-store sales growth during the month: Casual Dining and Fast Casual. Meanwhile, Upscale Casual, Quick Service, and Family Dining were essentially flat year-over-year.
And the only segment with decidedly negative same-store sales growth was Fine Dining.
After struggling most of 2024, Casual Dining has become the top-performing segment in the industry during the last three months. Additionally, these brands have been outpacing the rest by a large margin. However, not everyone in this top-performing segment is experiencing the same level of success.
Only 43% of the Casual Dining brands tracked by Black Box Intelligence had positive same-store sales growth during May. And for those experiencing declining sales? Average year-over-year same-store sales growth was a troubling -5%.
Extending the analysis to the entire industry reveals very similar results:
Only 43% of all restaurant brands tracked by Black Box Intelligence achieved positive same-store sales growth in May.
The segment with the weakest same-store sales growth during May was Fine Dining. It has now been at the bottom of the industry for two of the last three months.
YOY same-store sales growth
Best vs Worst: Region, Segment, and Cuisine
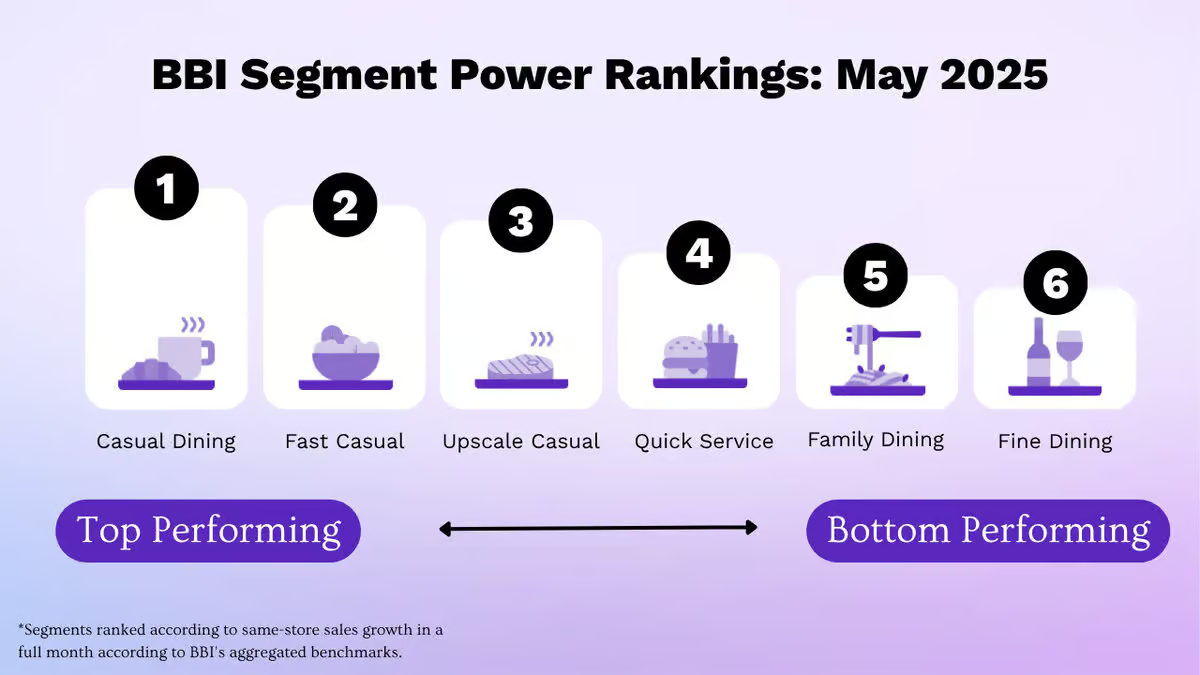
Overall, May 2025 restaurant industry trends from a geographic perspective offer cause for optimism. Only California was unable to achieve positive same-store sales growth during the month.
The regions with the next softest sales growth for May were Texas and the Western region. As recently reported by Black Box Intelligence, areas with a larger concentration of Mexican-origin populations have seen weaker restaurant traffic growth since the end of last year.
This could be contributing to the weaker performance in California and Texas.
Contrarily, the best-performing region of the country has been New England for the last three months. Subsequently, the Midwest, New York-New Jersey, and the Mid-Atlantic followed.
However, for New York-New Jersey and the Mid-Atlantic, this was primarily a function of restaurant sales surpassing weak numbers from a year ago. Meanwhile, New England and the Midwest have had strong, sustained performance. These regions have remained at the top of the industry, based on two-year growth rates. Meanwhile, New England and the Midwest have had strong, sustained performance.
These regions have remained at the top of the industry, based on two-year growth rates.
Segment Focus Deep Dive
Current Performance Trends in Family Dining
The Family Dining segment has been in a tough spot over the last 18 months.
-
It had a small negative same-store sales growth in 2024
-
Two Weeks into June, sales growth for the segment currently sits at -9.0%
-
Along with Fine Dining, they currently are the only two segments that are seeing negative same-store sales growth in 2025
-
Family Dining has been the segment with the weakest sales growth so far this year
Two factors have become headwinds for the Family Dining segment, both inflation-related.
BBI data shows Family Dining is one of the segments most negatively impacted by inflation. This is due to its reliance on the lower to middle-income consumer base. When prices rise rapidly, trade-downs to lower price options, offered by LSR, and trade-outs towards grocery accelerate.
Additionally, average spending per person increased by 2.8 percentage points more for Family Dining concepts. This was compared to the industry benchmark in 2023.
By 2024, the gap shrank. Yet, the segment saw growth in average spending per person. This was 1.5 percentage points more than the overall industry.
There is some potential good news for Family Dining in 2025. Check growth is moderating and is now lower than the average for the industry.
That being said, if inflationary fears persist, then optimism should be tempered.
Staffing, Workforce, And Employment Focus
Current Turnover Trends in Limited Service Restaurants
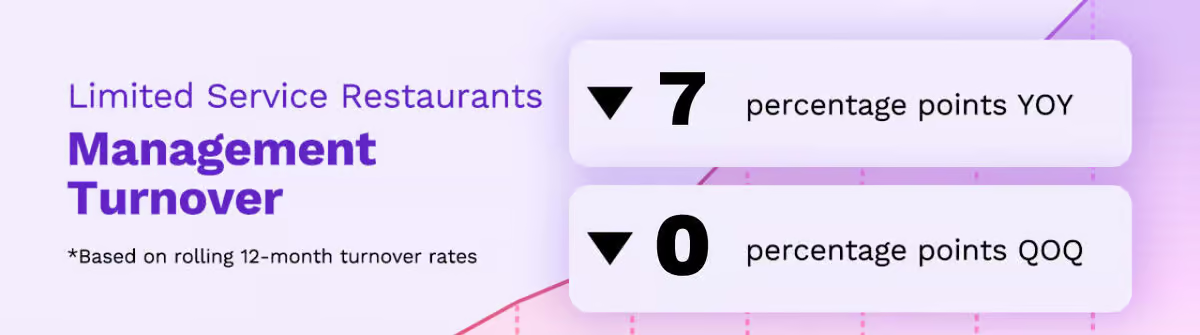
For the industry, Black Box Intelligence data shows that replacing a single manager represents over $10,000 in hard costs for all levels of management, excluding General Managers.
And replacing a single General Manager costs, on average, more than $16,000.
Yet, that’s just one component of the turnover effect. The most important aspect is the negative impact it can have on employee engagement and retention.
And its corresponding effect on restaurant performance. Retention, on average, had almost 1.0 percentage points higher same-store traffic growth than their peers.
Additionally, turnover for hourly, non-management employees was, on average, 21 percentage points lower.
Victor Fernandez, Chief Insights Officer, On:
Expectations for second half of the year
“The consumer has continued to show they are willing and able to spend their money at chain restaurants and create topline growth for the industry. But it continues to be a story of ‘haves and have nots’.”
“There are brands that have been able to successfully listen to their consumers, engage and motivate their employees, focus on the basics of their brand promises, and deliver on consistent execution, and win in the marketplace as a result. But this clearly is not the story for most”.
“However, the expectation continues to be softening conditions during the second half of the year, as well as harder year-over-year laps for the industry which means softening in sales and traffic growth rates are to be expected.”

For Deeper Analysis
Quarterly SOTI Webinars
We go into way more detail in our flagship quarterly State of the Industry (SOTI) webinar – our definitive take on the latest developments and a must attend for anyone in the restaurant industry.