May 2025 Monthly Second Helping: Highlighting Hot Topics in the Industry
Why US Immigration Policy Affects Consumer Spend: Shifts Impacting Restaurants
Since the 2024 Presidential Election, Black Box Intelligence has received lots of questions. Mainly, how are the new administration’s policies (especially regarding tariffs and immigration) affecting the restaurant industry?
These questions have been difficult to answer. Chiefly, this is because communication about these plans has been unclear or shifted multiple times. Thus, making it challenging to provide predictions with any degree of confidence.
However, based on our financial data and United States Census information, the evidence shows that spending habits have already changed among certain demographics.
Traffic Growth Softer in Zip Codes with Large Mexican Population
We grouped zip codes where over 40% of that zip code’s population is of Mexican origin. So what did we find? We observed a notably weaker traffic growth shortly before the 2024 U.S. Presidential election. This was compared to all other zip codes.
Please note, Black Box Intelligence is not insinuating that someone’s national origin implies anything about their citizenship status. Instead, we are using the best data available from the census that correlates most strongly with communities most affected by changes in immigration policies.
So, let’s dive into how US Immigration Policy Affects Consumer Spend…
The Zoomed Out View

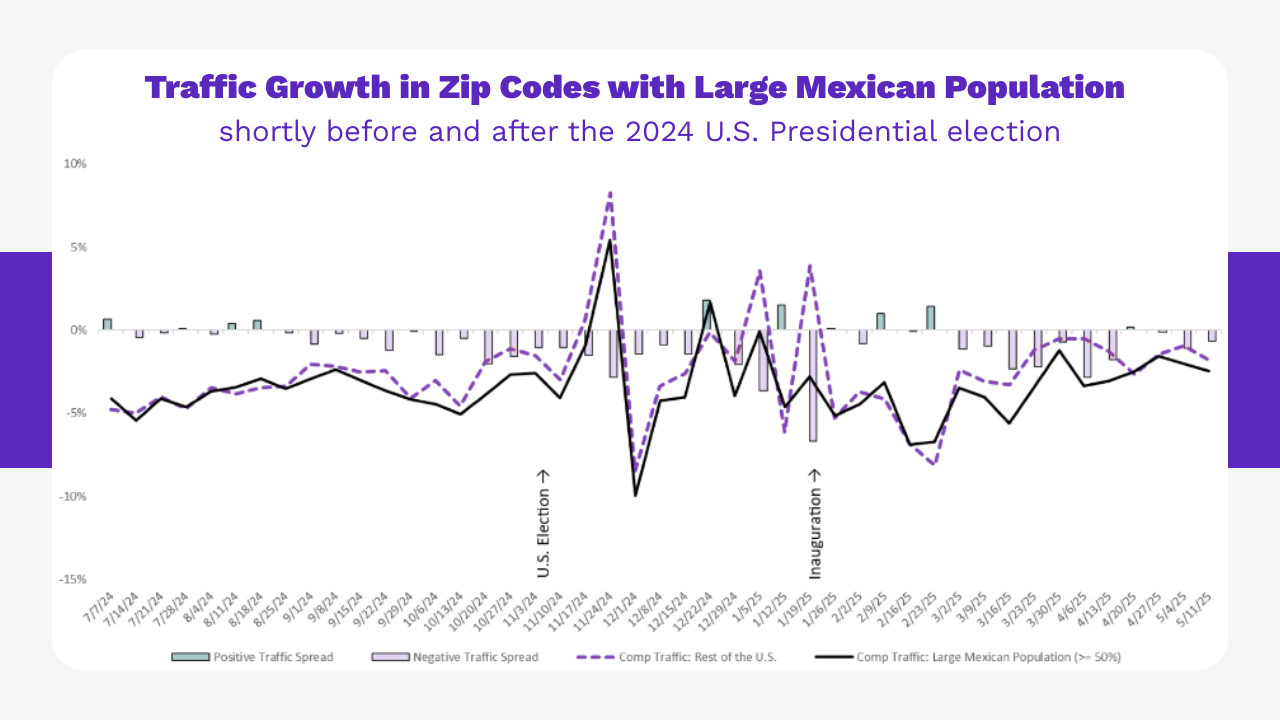
While Q2 and Q3 of 2024 saw very little difference in traffic in communities with a majority Mexican population than those without (0.2% and -0.2% traffic difference, respectively), as the US election got closer this difference began to widen.
Mexican majority zip codes started seeing less restaurant traffic growth industry-wide compared to other zip codes. The average weekly traffic growth difference in Q4 2024 was -1.2%. In Q1 2025 and Q2 2025 to date that traffic difference was -1.1%.
As you can see in the chart above, the black line (representing large Mexican population zip codes) consistently remains below the purple-dash line (rest of US zip codes) throughout the timeframe highlighted.
Zooming In

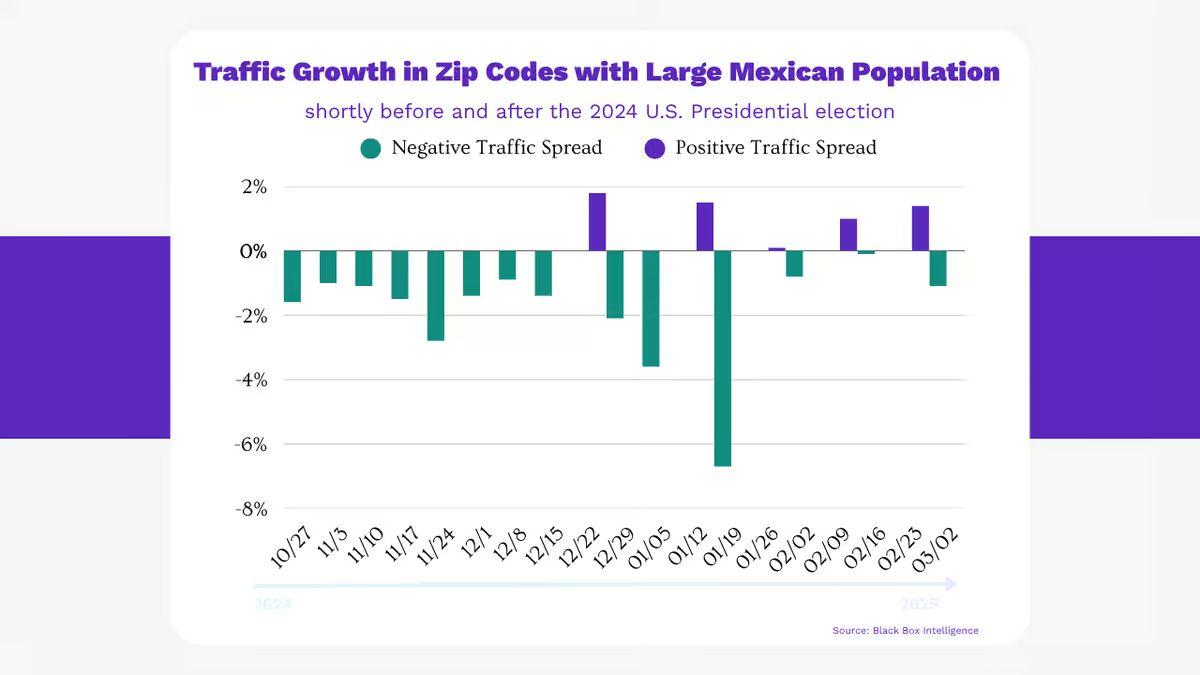
Lending even more credibility to this hypothesis, the negative traffic gap was at its widest during the weeks immediately after the election and the week of the inauguration.
The bars show the difference in traffic levels between majority Mexican zip codes vs the rest of the US on a weekly basis either side of the election.
Of the 17 weeks highlighted, traffic in majority Mexican zip codes was lower in 13 (or 76%) of these. The differences are particularly marked in key landmark weeks.
The negative traffic gap during key election weeks
| Traffic | Period |
|---|---|
| -1.5% | week immediate after election (11/17/24) |
| -2.8% | week two weeks after election (11/24/24) |
| -6.7% | week of inauguration (1/19/25) |
Only when the dust and court cases settle will we have a clearer picture of how the administration’s new policies will be implemented. And furthermore, what it will mean for the country and the restaurant industry.
However, in the meantime, the mere anticipation and anxiety around these issues seem to have been enough to impact the restaurant industry already.