
Customer insights can be gained from analyzing feedback data. This analysis helps businesses understand what customers truly want and improve their strategies to boost performance.
If this sounds like a bunch of hot air, it’s not. CX analysis uses proven methods to turn customer sentiment into clear numbers that businesses can use to enhance the guest experience and drive profits. And over the years, our data has continued to show that better CX leads to more sales and traffic growth.
In 2023, we looked into quantifying “hospitality” to explore its correlation with sales and traffic growth, particularly within full-service restaurants where hospitality is typically a top concern.
Using our Natural Language Processing tool, which leverages AI text analytics, online customer reviews were filtered and categorized using positive attributes such as “welcome,” “appreciated,” “attentive,” and “friendly” and negative attributes like “careless,” “rude,” and “unprofessional.”
Based on these reviews, brands were assigned a “hospitality” net sentiment score (NSS). For reference, an NSS quantifies overall customer sentiment by subtracting negative sentiments from positive ones, providing a clear measure of how customers feel about a certain brand.
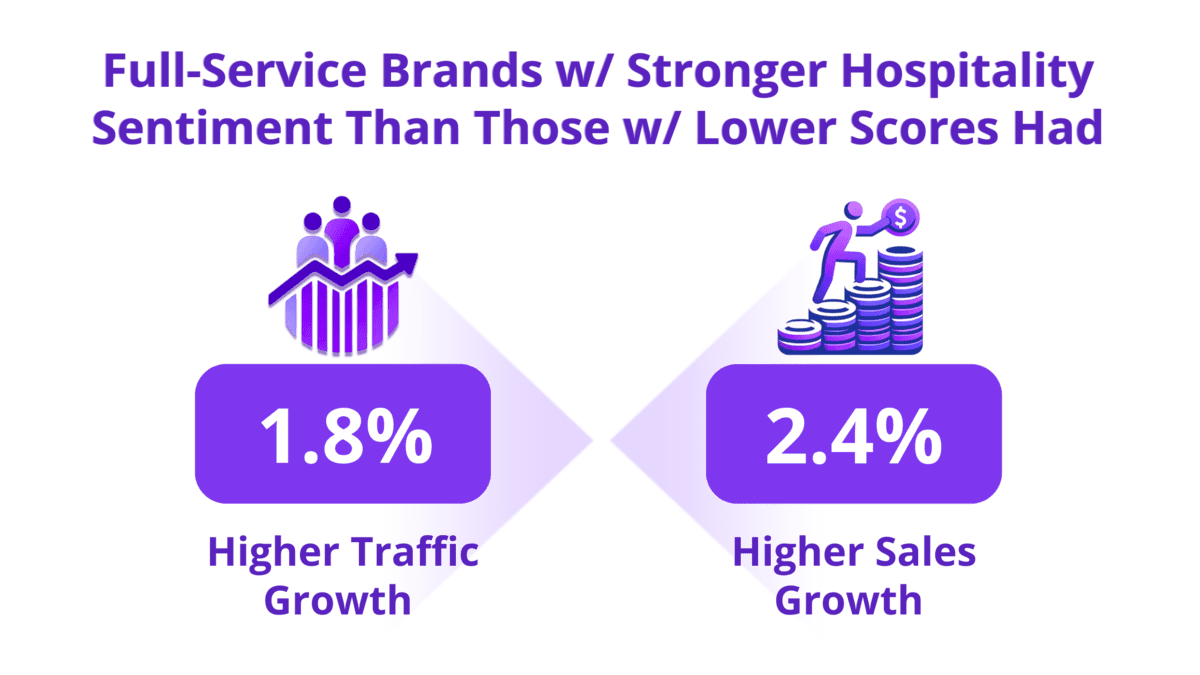
Infographic illustrating full-service brands benefiting from stronger hospitality sentiment, demonstrating CX’s Impact on Revenue.
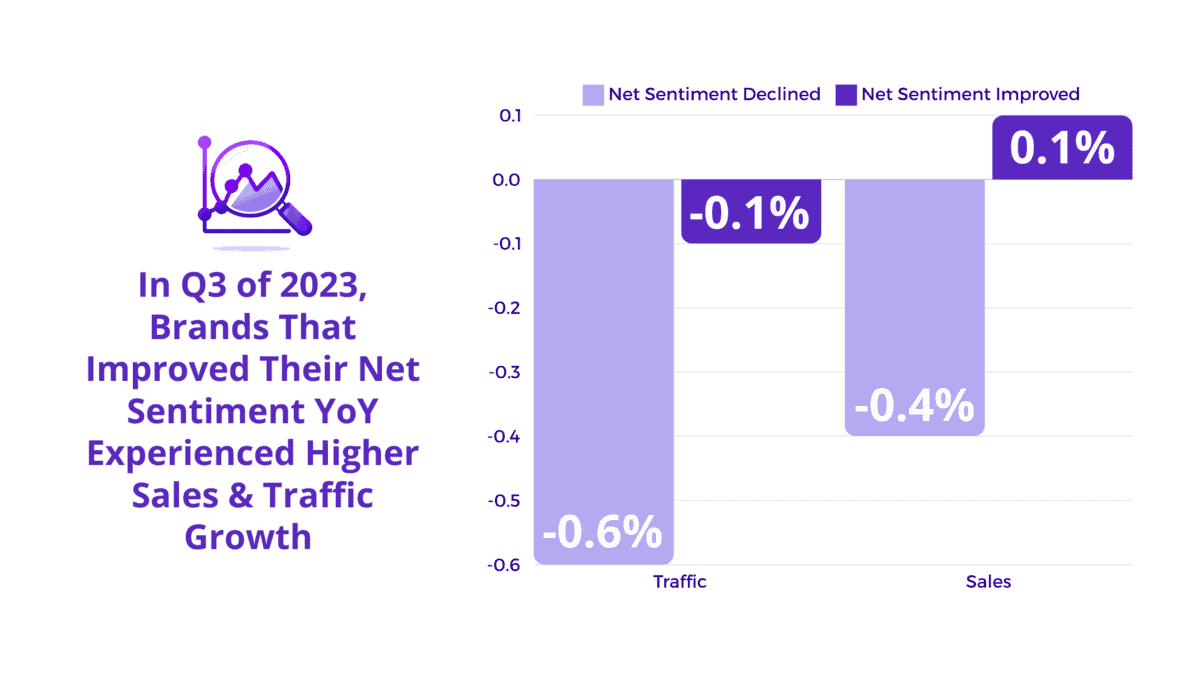
Bar chart showing net sentiment changes for brands in Q3 2023 highlights CX’s impact on revenue.
Our analysis showed that full-service brands with stronger hospitality sentiment outperformed those brands with lower hospitality by 2.4% and 1.8% for same-store sales and traffic growth, respectively. In a separate study, we explored the link between overall net sentiment and growth in traffic and sales. In Q3 of 2023, full- and limited-service brands that improved their net sentiment year over year experienced higher growth in both areas.
As mentioned in our April 2024 insights article, many restaurant operators now believe that the best way to measure success is by looking at their traffic growth rather than just their sales figures.
This shift comes after years of restaurants having little choice but to raise prices in the face of aggressive and relentless inflation, making sales growth less reliable for assessing performance.
So to gain a deeper understanding of what guests want from the customer experience today, we analyzed the highest-trafficked units (relative to direct local competitors) using online reviews of these establishments.
Black Box Intelligence segments guest sentiment data into six key attributes of the dining experience (food, service, ambiance, beverage, value, and intent to return) and their sub-attributes (e.g., portion size and quality for food; attentiveness and speed for service).
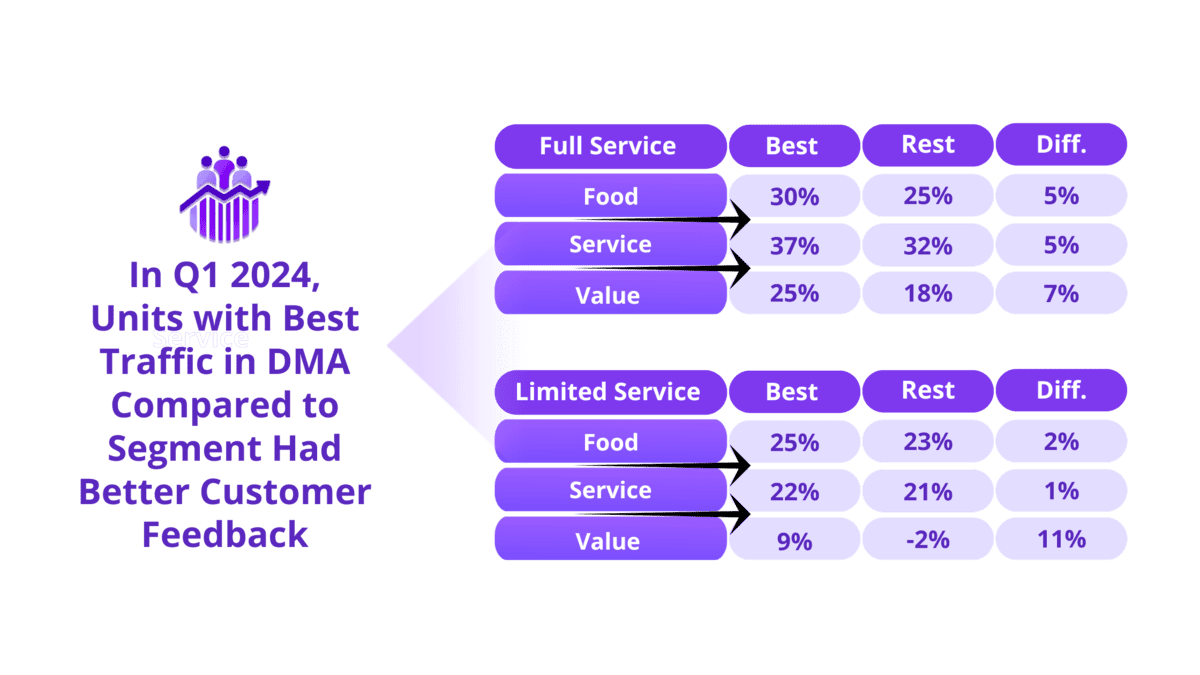
A comparison chart showing customer feedback in Q1 2024 to highlight CX’s Impact on Revenue.
Among the key attributes, food, service, and value emerged as the most important factors influencing traffic growth. On average, restaurants with the highest traffic growth had better food, service, and value NSSs than competitors in their designated market area (DMA):
Service:
- Customers tend to care more about service when dining at full-service restaurants: Full-service restaurants with the highest traffic had 5% better net sentiment than the rest. In limited service, the differential was only 1 point.
- Full-service restaurants with the highest traffic had 7% higher attentiveness, 6% higher experience, and 5% higher speed NSSs.
Food:
- Quality was a key factor for customers dining at full-service restaurants, while limited-service customers prioritized temperature.
- However, portion size mattered most in both restaurant categories: Units with higher traffic had 8 points higher portion scores for full service and a massive 34-point difference in limited service.
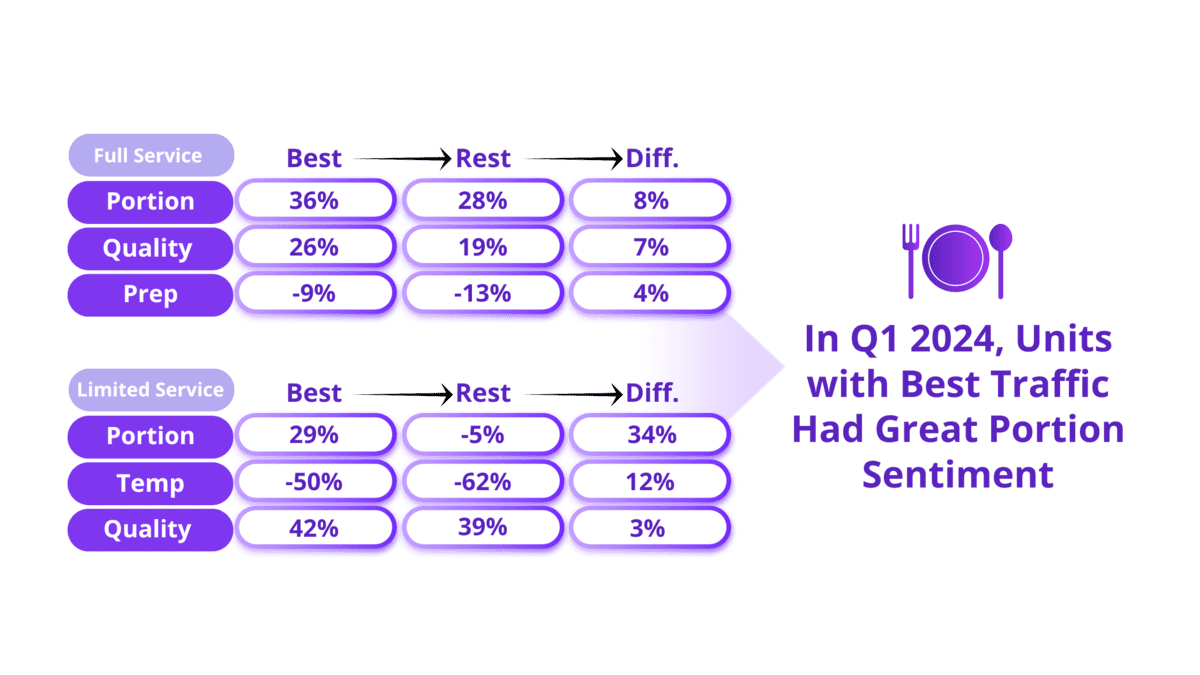
A comparison chart highlights data for “Full Service” and “Limited Service” in portions, quality, and preparation, emphasizing CX’s Impact on Revenue.
Value:
- Value was a more significant differentiator than both food and service: restaurants with the best traffic growth averaged 7 points higher value net sentiment scores in full service and 11 points higher in limited service.
- This makes sense: value is especially important to customers during times of economic uncertainty. Brands that saw the most improvement in their value net sentiment scores between 2019 and 2023 had 1.5 times higher sales growth and an enormous 8 times higher traffic growth.
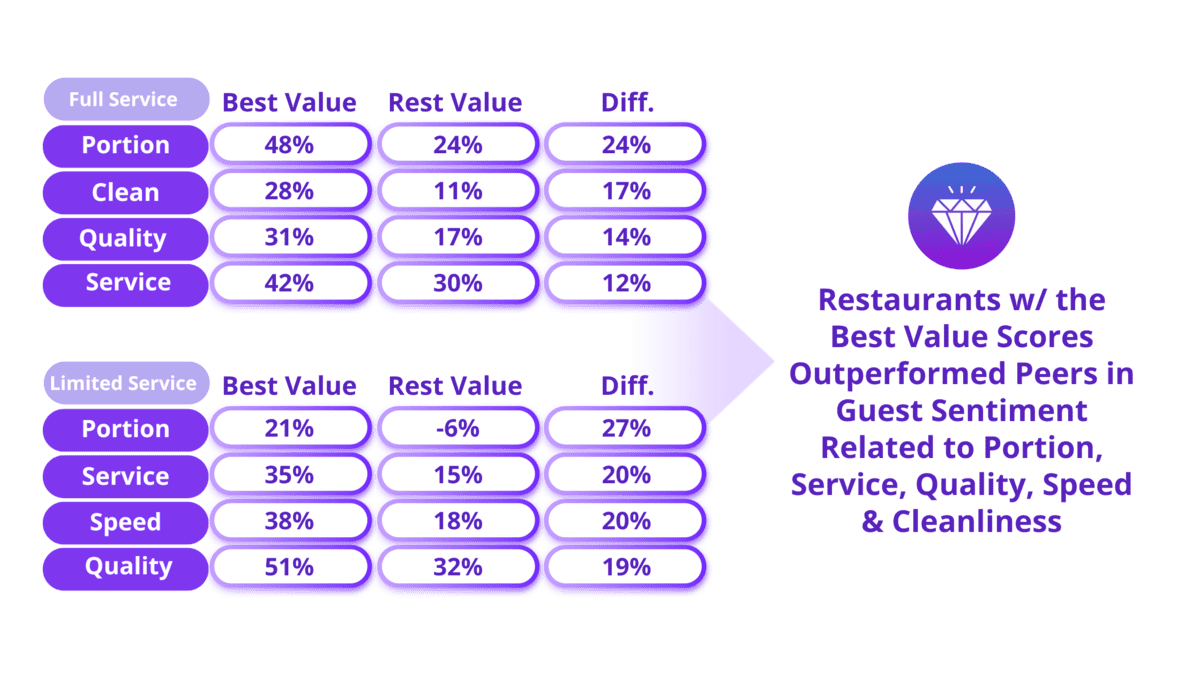
- Additionally, in Q1 of 2024, restaurants with the best value scores outperformed their peers in guest sentiment related to portion (which was found to be the biggest differentiator), service, quality, speed, and cleanliness.
Star ratings can have a profound effect on a business’ performance. They often serve as the first impression for potential customers—for better or worse.
When we looked at a sample of over 1.4 million reviews across Google, Yelp, Facebook, and TripAdvisor, Google stood out as the most critical review channel. So when customers are searching for a business online, chances are they’ll catch a glimpse of the company’s Google average star rating (ASR) first. Google star ratings are not only a helpful statistic—they are actually one of the most important predictors of the success of a business.
And according to our data from 2023, an improvement in ASR tends to lead to higher sales and traffic growth: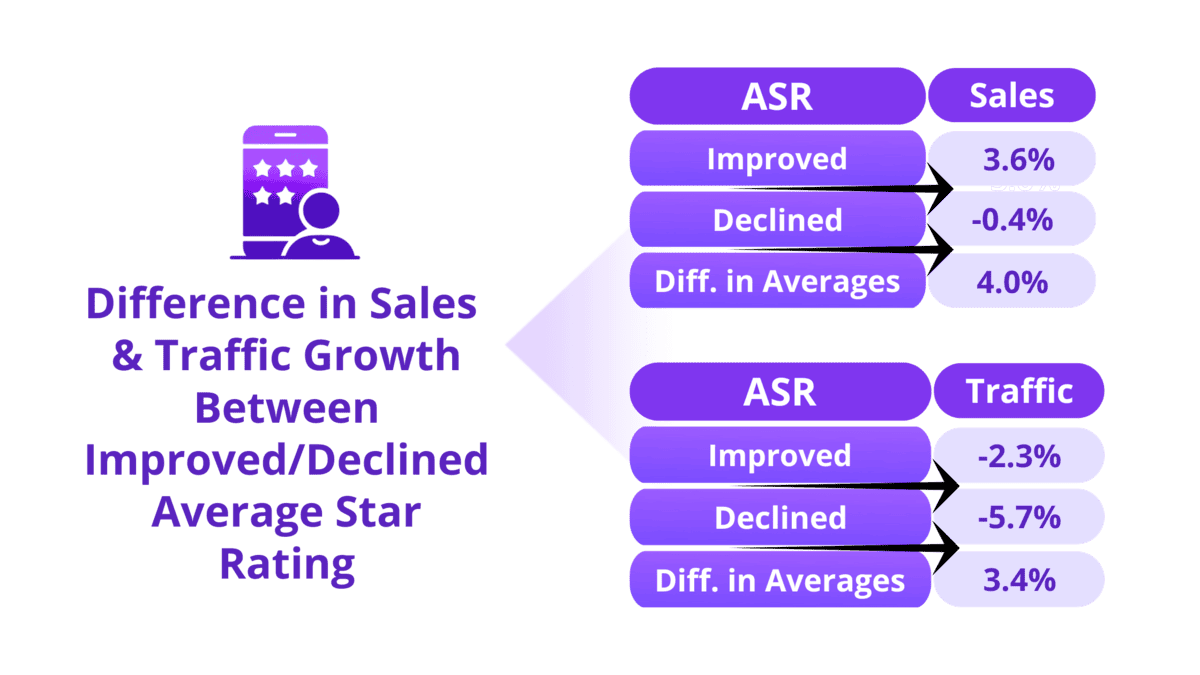
- Brands that generated an improvement in their ASRs had, on average, 4 percentage points higher sales growth and 3.4 percentage points higher traffic growth than those who experienced a decline in ratings.
- Limited-service restaurants with a 3.0-or-lower star rating had 23% worse absolute traffic than the average for all restaurants in their industry segment operating in the same market. Full-service restaurant units with the same low rating had 54% worse absolute traffic than their local peers.
- Limited-service and full-service units with a 4.4 rating or higher had better absolute traffic (12% and 13%, respectively) than their local benchmarks.
- Full-service restaurants with a rating of 3.6 to 3.9 still had 23% worse traffic than peers operating in their DMA, emphasizing just how important it is for a full-service restaurant unit to reach a 4.0-star rating.