Workforce Intelligence for Restaurants
Restaurant Workforce Benchmarks That Turn Gut Feel Into Data-Backed Action
Black Box Workforce Intelligence gives you the industry’s most reliable restaurant workforce benchmarks, powered by the Restaurant Performance Network. Get a clear view of how to improve retention, staffing, and performance – at scale.
On average, staff turnover costs:
30+ Years Serving the Biggest Names in the Restaurant Industry


Restaurant Workforce Benchmarks
Why the C-Suite and HR Teams Trust
Black Box Workforce Intelligence
Whether you’re managing 30 or 3,000 locations, Black Box Workforce Intelligence gives you the data clarity and market visibility to lead with confidence. Restaurant compensation, training and turnover benchmarks designed to propel you to your maximum potential.


“I live and die by the BBI data. It is the only platform that allows us compare apples with apples and accurately see how we’re trending in key HR performance areas – namely retention, and compensation and benefits.”
Arlene Estrada Petokas – Chief People Officer, Kura Sushi USA

Turn Workforce Strategy Into Competitive Advantage
Restaurant Workforce Benchmarks That Tell You: Is it YOU or the Market?
Gold Standard Restaurant Workforce Benchmarks
Powered by the Restaurant Performance Network
BBI’s restaurant workforce insights come from the Restaurant Performance Network – the largest and most reliable source of financial, workforce, and guest data in the industry.
Maximize your potential with the complete one-of-a-kind performance roadmap that provides all the answers.
Never again wonder: “Is it the market or…ME?”.
Restaurant Workforce Benchmarks: Turnover
Complete Turnover Insight
-
Track and benchmark turnover right down to the local, DMA or even unit level – from the C-suite to your hourly employees.
-
Intimately understand the cost of turnover to your business with our sales and traffic models.
-
Identify underperforming units and deliver operators data-driven action plans.
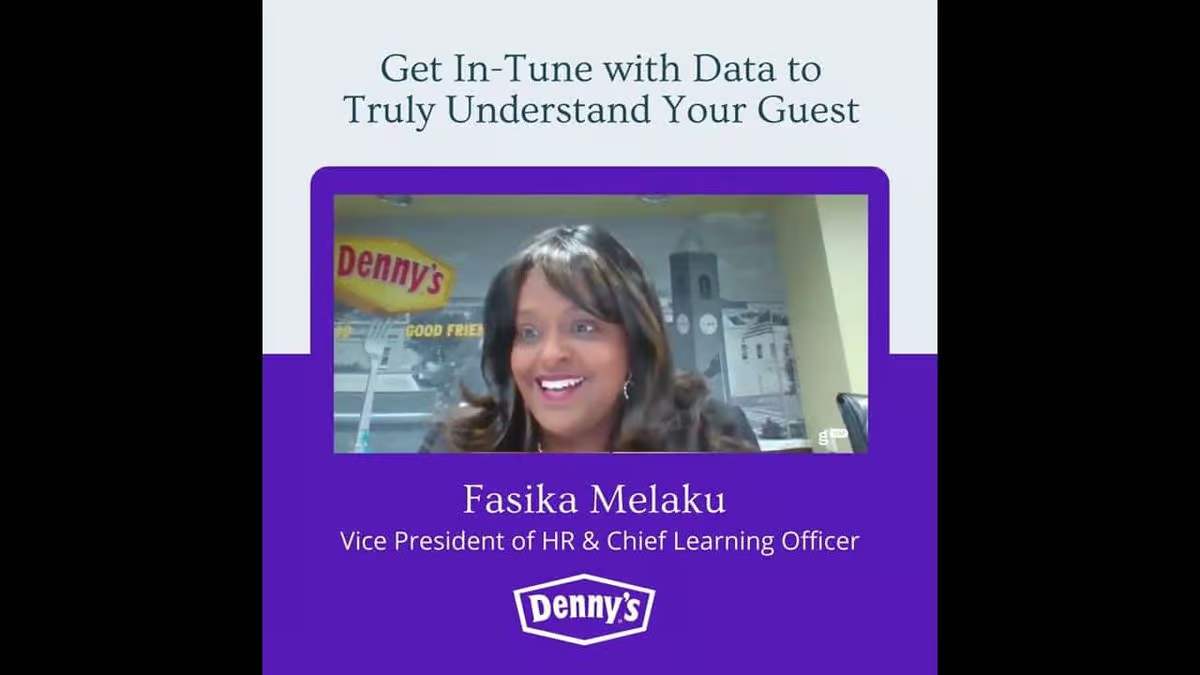
BBI Customer Perspective
“An a-ha moment for us was just how much EVERYONE gravitated to the BBI data – from leadership and the field to the owners.”
Fasika Melaku, Vice President, HR and Chief Learning Officer – Denny’s
Restaurant Workforce Benchmarks: Pay & Benefits
Build the Best Rewards Packages
-
Includes base salary, bonus, paid time-off and even training investment
-
Initiate highly educated compensation strategies that balance available resources with talent you want to attract.
Built for Restaurant HR, Ops, and Finance Leaders
Whether You’re leading HR, Supporting Field Ops, or Advising the C-Suite, Our Restaurant Workforce Benchmarks Help You:

Reduce Costly Turnover and Improve Employee Lifetime Value

Align Pay and Staffing Strategies with Evolving Market Conditions

Build Data-Backed Business Cases For Investments in People and Culture

Lead Labor Strategy at Scale Across Thousands of Locations.
“Black Box Workforce Intelligence has been a huge help entering new markets. As our company has scaled from 20 to 50 stores and on to 100+, we are able to benchmark people power by department vs the industry to see where we have needs.”
Ronnie Berry, Chief Administrative Officer, City Barbeque

“Black Box Workforce Intelligence consistently provides timely and valuable benchmarking data that we use to make key decisions.”
Dina Barmassee-Gray, Chief People Officer, The Cheesecake Factory

“Black Box Intelligence has helped Culver’s obtain regional competitive information that is so important to support our recruiting and retention efforts.”
Matt Klug, VP of HR, Culver’s

Black Box Intelligence Platform
Compound the Value of Black Box Workforce Intelligence by Combining it With the Rest of the BBI Platform.


Performance Intelligence
Fueling the AI Restaurant Command Center With Key Insights
The restaurant turnover and compensation benchmarks provided by Workforce Intelligence combines with the rest of our platform to fuel our AI Restaurant Command Center – Performance Intelligence.
-
Gain clarity on impact of turnover and compensation on financial performance.
-
Precisely size impact of guest experience and marketing promotions on sales and traffic.
-
Know what’s working, what’s failing, and exactly what to do next.

Talk to us today!
Leave your contact details to learn more about our restaurant workforce benchmarks and we’ll be in touch.