Restaurant Glossary
Comp Traffic
Definition:
Comp Traffic, short for Comparable Traffic, is a metric used in the restaurant industry to measure the number of customer visits to a location during a specific period, compared to the same period in the previous year.
Like Comp Sales, Comp Traffic focuses on locations that have been open for at least one year, allowing operators to assess the performance of established locations without the influence of new openings or closures.
This metric helps restaurants understand changes in customer behavior, such as increases or decreases in foot traffic, which directly impact overall sales performance.
Why It Matters:
- Customer Engagement:
Traffic is a direct indicator of how effectively a restaurant is attracting and retaining customers.Positive Comparable Traffic growth suggests successful marketing efforts, menu offerings, or customer service improvements, while negative trends may indicate issues that need addressing.
- Sales Performance:
Traffic is a critical driver of sales. Increases in Comparable Traffic typically lead to higher comp sales, as more customers result in more transactions.Understanding traffic trends helps restaurants identify whether sales changes are due to shifts in customer volume or other factors like average check size.
- Operational Insight:
By tracking comp traffic, restaurant operators can gain insights into operational performance at specific locations.For example, if Comparable Traffic is declining at a particular restaurant, management can investigate potential causes, such as changes in the local market, competition, or customer satisfaction.
- Benchmarking and Strategy:
Comparable Traffic provides a valuable benchmark for comparing performance across different locations and against industry averages.It helps restaurants develop targeted strategies to increase foot traffic, such as promotions, events, or changes to the menu or service model.
Calculation:
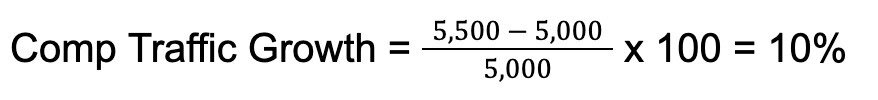
Comp Traffic is typically expressed as a percentage change in the number of customer visits compared to the same period in the previous year.

For example, if a restaurant had 5,000 customer visits in Q1 of the previous year and 5,500 visits in Q1 of the current year, the comp traffic growth would be:
Example in Action:
A restaurant chain experiences a 7% increase in Comparable Traffic during Q3, which management attributes to a successful new marketing campaign and the introduction of a popular seasonal menu item.
The rise in foot traffic leads to higher overall sales and boosts the restaurant’s comp sales figures for the quarter.
By analyzing comp traffic data, the chain can replicate these strategies in other locations to drive further growth.
Related Terms:
- Comp Sales:A metric that measures the sales performance of established locations compared to the same period in the previous year, often influenced by changes in comp traffic.
- Foot Traffic:The number of customers entering a restaurant, which directly impacts sales and revenue.
- Customer Turnover:The ability of a restaurant to keep existing customers returning, which is crucial for maintaining or increasing Comparable Traffic.
Conclusion:
Comparable Traffic is a crucial metric for understanding customer visit patterns at established restaurant locations.
By tracking changes in comp traffic, restaurants can assess the effectiveness of their marketing, menu, and service strategies, and make informed decisions to drive customer engagement and increase sales.
Positive Comparable Traffic trends indicate successful customer attraction and retention efforts, contributing to overall business growth.