Connected Restaurant Performance
A Single View of Performance
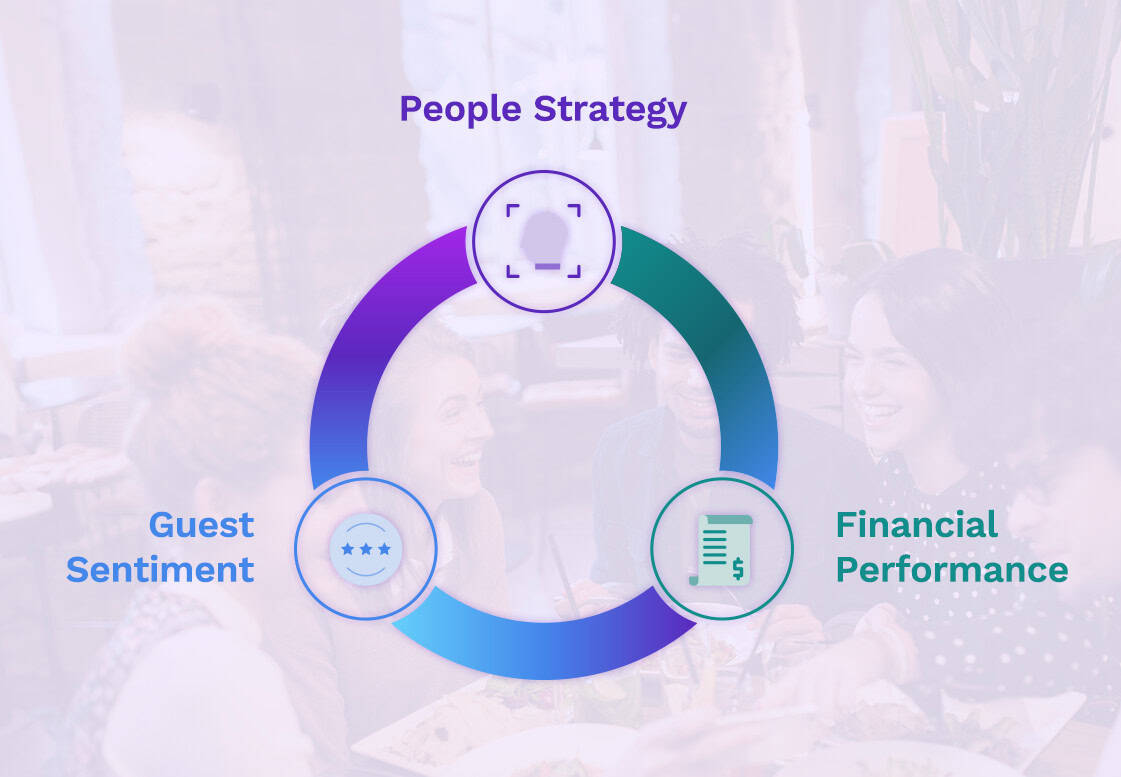
With Black Box Intelligence, you don’t just collect data – you connect it.
We bring guest feedback, staffing metrics, and financial benchmarks together in one platform to help you act faster, align teams, and improve performance systemwide.
30+ Years Serving the Biggest Names in the Restaurant Industry


The AI Restaurant Performance Platform
Why Top Restaurant Brands Rely on Us

Silo-Breaking Restaurant Intelligence
Align Across Your Business
Finally get your executive, marketing, finance, HR and operations groups on the same page.
Most brands track performance in silos – guest surveys in one tool, labor data in another, and financial results somewhere else. That disconnect leads to slow decisions, reactive fixes, and missed opportunities.
BBI gives you a complete, connected view of your business—so you know what’s working, what’s not, and what to do about it.
“How much our entire organization gravitated to this information was a real a-ha moment.”
Fasika Melaku, VP HR & Chief Learning Officer, Denny’s
What You Can Do With Connected Restaurant Intelligence
Spot the Root Cause, Not Just the Symptom


BBI helps you correlate signals across financial, workforce, and guest data so you can move with precision.
Improve Restaurant Performance
Act Fast With Confidence
-
Know which units need help—and why.
-
Prioritize based on financial impact, not gut feel.
-
Shift from “we think” to “we know.”
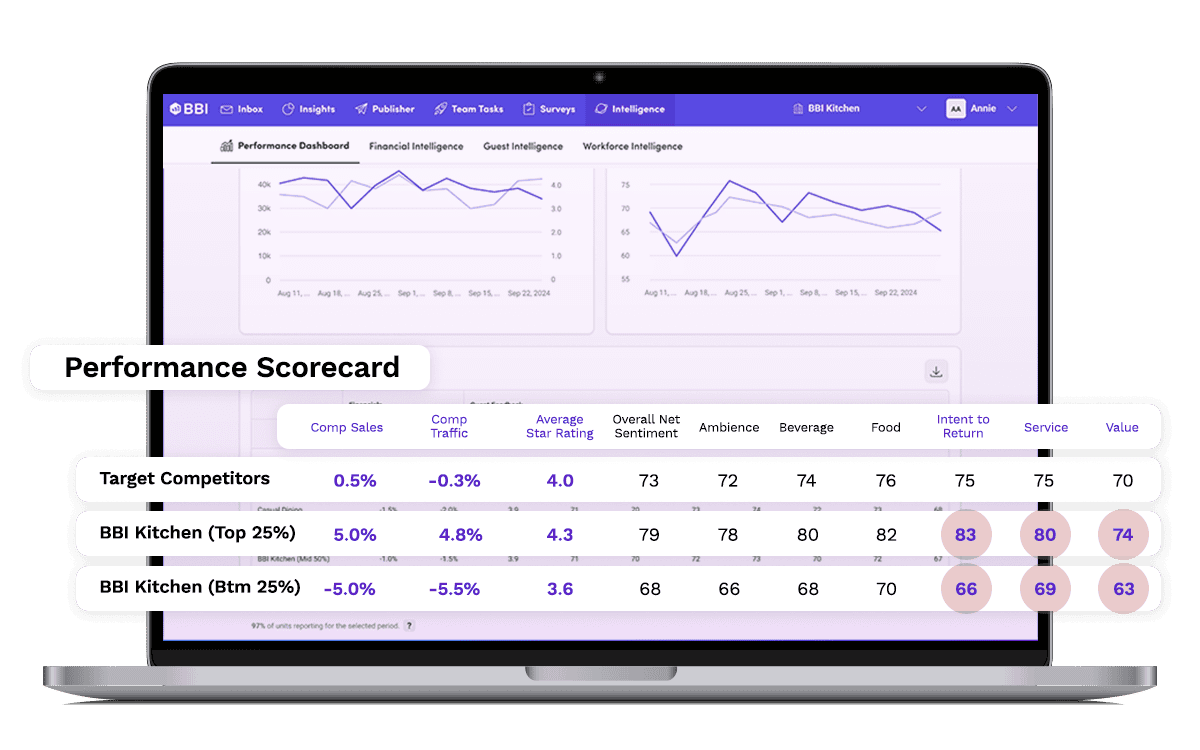
Our Performance Intelligence dashboards connect the dots across data sets—so operators, finance, HR, and marketing can act in sync.
Create Shared Focus and Alignment
Hard Conversations With Data Just Become…Conversations

Align across finance, marketing, HR and operations.

Focus specifically on traffic and sales drivers.

Create cultures of internal change and progress.
“Correlating the financial data with the workforce and guest sentiment data tells us a very clean story of where we are and where we need to get to.”
Brad Jacobus, CMO – Jim ‘N Nicks
A Predictive Roadmap for Success
Build Plans That Actually Work
Use historical benchmarks, live signals, and predictive trends to:
-
Track the financial ROI of your guest experience initiatives
-
Forecast turnover risk and its impact on guest scores
-
Model how labor investments affect top-line growth
This is performance modeling with real-world restaurant context, not hypothetical theory.
Traffic and Sales Modeling
Map Everything to Traffic and Sales
Gold Standard Performance Benchmarks
Powered by the Restaurant Performance Network
Our intelligence comes from the Restaurant Performance Network – the largest and most reliable source of financial, workforce, and guest data in the industry.
Maximize your potential with the complete one-of-a-kind performance roadmap that provides all the answers.
Never again wonder: “Is it the market or…ME?”.
More Reasons Top Brands Partner with Us
Why BBI


Ready to Take the Next Step?
Leave your contact details and we’ll be in touch.