Restaurant Glossary
Comp Sales (Same-store sales)
Definition:
Comp Sales, short for Comparable Sales, is a key financial metric used in the restaurant industry to measure the performance of locations that have been open for a significant period, typically at least one year.
Also known as same-store sales, this metric compares the current period’s sales with the sales from the same period in the previous year.
Thus, this allows restaurants to assess growth or decline in revenue at established locations, excluding the impact of new openings or closures.
Why It Matters:
- Performance Indicator:
Comparable Sales is a critical indicator of a restaurant’s operational health, showing how well existing locations are performing without the influence of expansion.Positive comp sales growth suggests that a restaurant is increasing revenue from its established customer base. Meanwhile, negative growth could signal issues that need to be addressed. - Investor Confidence:
For publicly traded restaurant chains, same-store sales are closely watched by investors and analysts as a measure of the company’s financial stability and growth potential.Consistent comp sales growth can boost investor confidence and positively impact stock prices.
- Operational Focus:
Tracking comparable sales allows restaurant management to focus on improving operations at existing locations rather than relying solely on new openings for growth.It highlights the importance of customer retention, menu optimization, and marketing strategies in driving repeat business.
- Benchmarking:
Comp Sales provides a benchmark for comparing performance across different locations or against industry averages.
This helps restaurants identify underperforming locations and develop targeted strategies to improve their performance.
Calculation:
Same-store sales is calculated by comparing the sales from a current period (e.g., a quarter or a year) to the sales from the same period in the previous year for locations that were open during both periods.
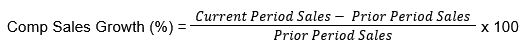
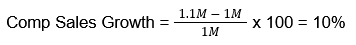
For example, if a restaurant had sales of $1 million in Q1 of the previous year and $1.1 million in Q1 of the current year, the comp sales growth would be:
Example in Action:
A restaurant chain reports a 5% increase in comp sales for Q2, indicating that its existing locations are performing better than they did in the same quarter the previous year.
The management attributes this growth to a successful new menu rollout and an effective loyalty program that encouraged repeat visits.
This positive comp sales performance signals to investors that the chain is successfully driving revenue growth without relying on opening new locations.
Additional Resources & Related Terms
- Total Sales:The total revenue generated by all locations, including new and existing ones. Total sales growth combines the impact of same-store sales and new store openings.
- Traffic:
The number of customers visiting a restaurant. Traffic growth is a key driver of comp sales, as more visits typically lead to higher sales.
- Average Check:
The average amount spent per customer. Increases in average check can contribute to comp sales growth even if traffic remains flat.
Conclusion:
Comp Sales is a vital metric for understanding the performance of established restaurant locations.
By focusing on comparable sales growth, restaurants can gauge their success in retaining customers, optimizing operations, and driving revenue.
Positive same-store sale trends indicate a healthy business, while declines may prompt a reevaluation of strategies to improve customer satisfaction and sales performance.