DECEMBER: BY THE NUMBERS (Y-O-Y)

-0.3%
Comp Sales
-3.2%
Comp Traffic
Best Region: New England
Best Segment: Family Dining
Best Cuisine: Breakfast
Worst Region: NY-NJ
Worst Segment: Fast Casual
Worst Cuisine: Sandwich

The December 2024 Restaurant Industry Trends + A Year in Review

2024 saw many ups and downs. The numbers for December are finally in. So, how did the restaurant industry fare?

December’s sales and traffic data may appear weak at first glance. However, a deeper dive reveals a more interesting story.

Here is the latest data plus 2024 Restaurant Industry Trends brands need to set 2025 up for success.

December 2024: The Holiday Impact

One of the most significant factors affecting December 2024’s performance was the calendar.

As discussed in our November Out of the Box, Thanksgiving was late during the month this year.

It technically fell into December, according to our standardized reporting calendar.

And the late Thanksgiving also affected early December results.

Sales and traffic growth were weaker during the first week of December.

And while this comparison is important to understand, it doesn’t tell the whole story.

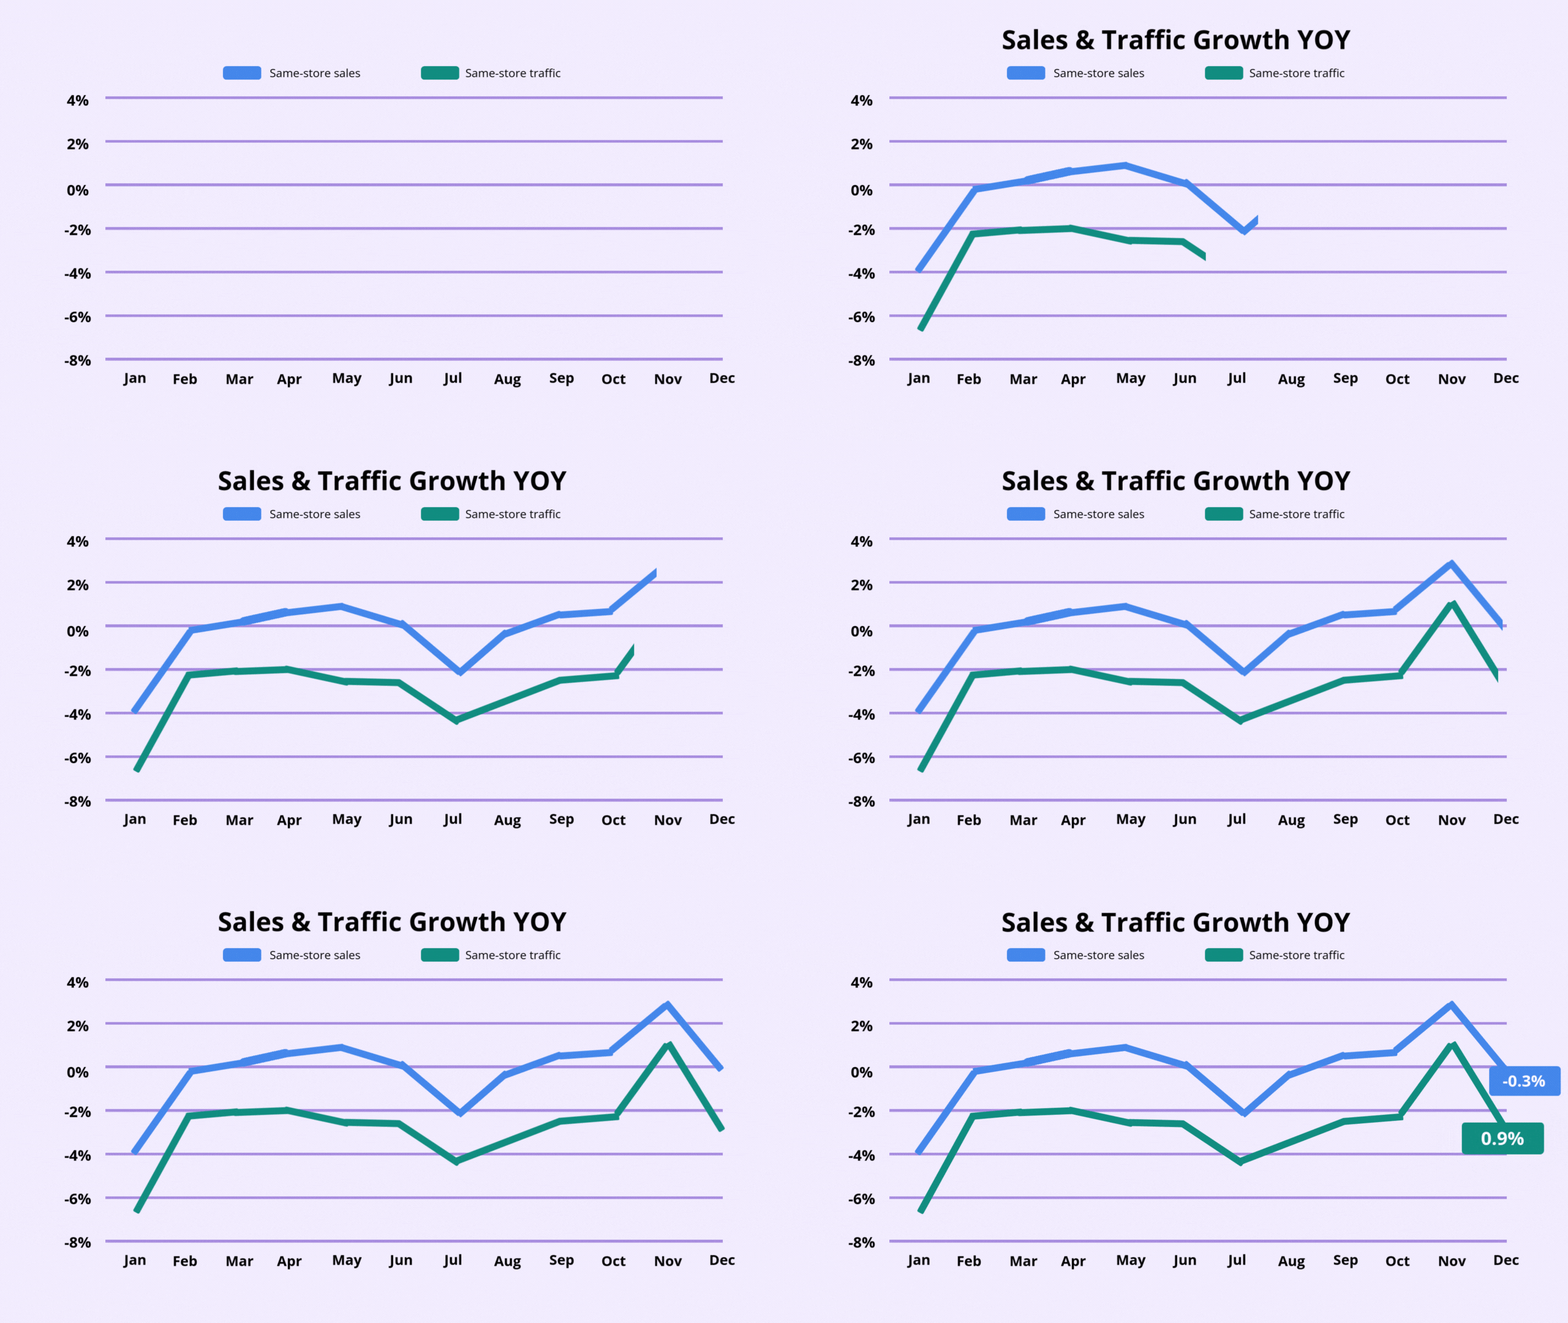
  • Same-store sales growth in December: -0.3% year-over-year (YOY)
  • Same-store traffic growth in December: -3.2% YOY

Certain restaurant segments are more affected by holidays than others.

For example, Fine Dining often experiences significant slowdowns during holidays.

Meanwhile, Quick Service may see a smaller dip due to takeout and delivery demand.

Understanding these segment-specific impacts is crucial for planning future holiday strategies.

A More Comprehensive View: November and December Combined

To account for the calendar shift, it’s vital to view the last two months as a combined period for sales and traffic.

This provides a clearer picture of the restaurant industry overall.

Moreover, it avoids the misleading noise caused by Thanksgiving’s placement.

These are the key insights we found:

  • November and December combined saw a strong 1.1% in same-store sales growth.
  • This combined average growth rate is stronger than any other month in 2024. Thus, highlighting the industry improvements since hitting a low point in July.
  • Based on same-store sales growth, the best-performing segments for this period were Casual Dining and Quick Service.

Additionally, Same-store traffic growth results for the combined period was -1.4%.

The average growth for the last two months of the year was also stronger than any other month of 2024.

Furthermore, that’s the second highest since February of 2023.


2024 in Review

Now that all the data is compiled, how did 2024 fare overall?

Contextualizing 2024 Performance

To truly understand how the restaurant industry performed in 2024, we need to look beyond monthly snapshots and review the entire year’s data – and compare how it stacks up to previous years.

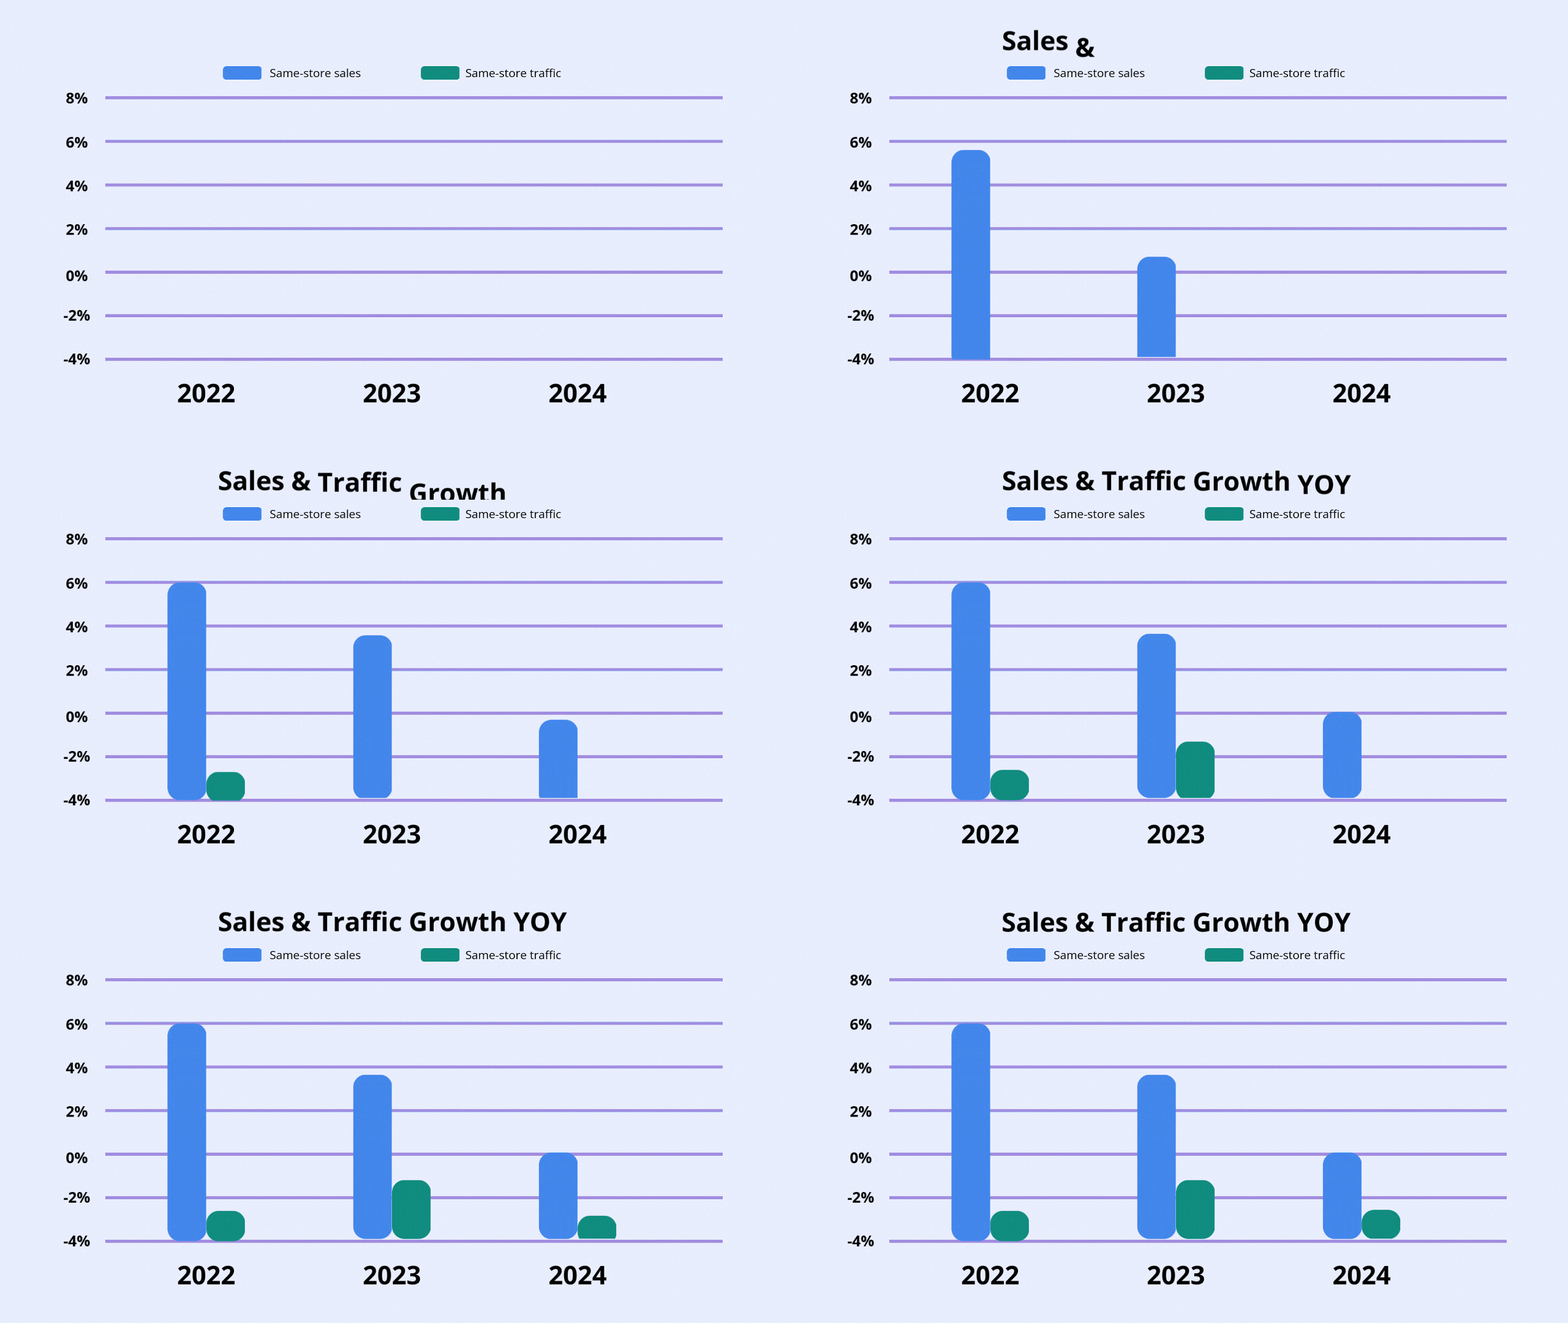
Time Period Sales Traffic
2024 0.0% -2.8%
2023 -1.4%
2022 -2.6%

Overall, 2024 was a challenging year for the restaurant industry – especially in comparison to the previous two. Traffic declined at a higher rate (albeit marginally vs 2022) and sales were notably lower.

However, as noted, we saw encouraging upticks at the back end of 2024 and are predicting a stronger 2025 (our most recent projections anticipate 0.4% higher Y-o-Y traffic and 0.5% higher Y-o-Y sales). We will be issuing updates to these projections on our next quarterly Restaurant Industry Snapshot webinar.

Reflecting on 2024

Month Jan. Feb. Mar. Apr. May Jun. Jul. Aug. Sept. Oct. Nov. Dec.
Comp. Sales -4.5% -0.6% +0.1% +0.6% +0.4% -0.1% -2.3% -0.4% +0.4% +0.5% +2.8% -0.3%
Comp. Traffic -7.1% -2.3% -2.2% -2.3% -3.1% -2.8% -4.6% -3.6% -2.7% -2.5% +0.9% -3.2%

Black Box Intelligence tracked the trends that defined each season—from mid-year lows to holiday peaks. This timeline serves as a comprehensive review of what worked, what didn’t, and how leaders can use this data to plan for an even stronger 2025.

A Year in Review

Trends from 2024

Navigating Industry Performance Amidst Weather and Economic Challenges

January offered little clarity in terms of the current health of the restaurant industry from a year-over-year growth perspective.

Several factors added noise to the data, contributing to results for the month that were much more negative than expected, painting a bleak and inaccurate picture of the industry.

The biggest factor was the weather. Large areas of the country experienced unusually cold weather fronts or rainfall during January, negatively impacting restaurant sales and traffic.


Concerning Decline in Sales Alongside the Critical Importance of Maintaining Cleanliness For Positive Customer Ratings.


February of 2024 revealed a concerning decline in sales alongside the critical importance of maintaining cleanliness for positive customer ratings.

Data for this month showed that the expected slowdown in restaurant sales was beginning.

Meanwhile, reviews that contained a cleanliness-related mention have an ASR of 3.2 for full-service restaurants, nearly a full star below the overall rating for 2023. In the case of limited-service restaurants, the ASR of reviews that contain a reference to cleanliness is 3.3, which is almost half a star lower than all reviews for this category. Thus, making it a focus-point in early 2024.

With Sales & Traffic Relatively Soft, Value May Be the Key to Success for Restaurants

March 2024 saw a modest sales growth and declining traffic, the key to restaurant success lies in understanding consumer behaviors amidst inflation, emphasizing the importance of value offerings and customer experience for sustained growth.

March was the weakest month for same-store sales growth in restaurants in the last three years.

As economic conditions softened through Q3 of 2024, it seemed to be the consensus from economists that lower-than-normal check growth would help prevent restaurant traffic from plummeting.

Sales Gains Driven by Check Growth, but Value-Centric Restaurants Lead in Traffic Growth

Although the US employment numbers remained robust, consumers were still insecure about the economy. If brands have no choice but to raise prices, their focus should shift to delivering other parts of the value equation.

April was the strongest month for same-store sales at that point in the year. However, sales growth remained weak compared to the 1.9% average seen in the second half of 2023.

We began seeing brands, who had no choice but to raise prices, focus shift to delivering other parts of the value equation in order to stay competitive.

Restaurants Struggle to Maintain Google Ratings and How it Impacts Sales

Same-store sales growth was +0.4% in May, which represented a 0.2 percentage point drop in year-over-year growth relative to April.

Sales growth was less than +0.6% during each month of 2024 at this point, noting the Industry’s struggles.

And in the era of the internet and Google Reviews, Average Star Rating (ASR) became a huge factor in seeing success.

Sales and Traffic Slow Downs While Consumers Expecting More Value From Their Meals

As we moved into June, it’s became increasingly clear how the declining economy at the time was impacting the restaurant industry.

With high inflation of the post-COVID years, price-sensitive consumers adjusted their internal calculation as to when and where to eat out.

June also marked a significant moment for restaurants, as same-store sales growth slipped to -0.1%, representing a 0.4 percentage point deceleration in sales growth.

July’s Anomalous Performance and Industry Recovery

July marked a low point for the industry.

The steep decline was driven by a combination of external factors, including a surge in viewership for the summer Olympics, a rise in Covid-19 cases, and unusually hot weather in the West and Northeast.

These issues led to decreased consumer traffic and spending, resulting in the worst performance the industry has seen since January.

The Turning Point of 2024

August marked a potentially pivotal moment for the restaurant industry.

After several challenging months, signs of recovery were beginning to appear. We were also able to dive into this year’s Total Rewards Survey. This revealed a much more optimistic picture when it comes to staffing.

46% of companies said they are fully staffed in front of house hourly positions (up 41 percentage points from 2022) and 37% say they are fully staffed in back of the house positions (up 27 points from 2022).


Bouncing Back From July and Impacts of Hurricane Helene

The September 2024 data painted a relatively optimistic picture for the restaurant industry.

Despite a tough summer and setbacks caused by Hurricanes Helene and Milton, recovery is on the horizon with positive momentum in both sales and traffic.

The industry was able to continue its more positive momentum with September’s 0.4% same-store sales growth. This was the best month for the industry since April’s year-over-year sales growth.


Balancing Price and Value to Reach Success

October 2024 marked a pivotal month for the restaurant industry. It showed positive same-store sales growth and improving traffic trends.

Segments that are outperformed the industry proved that Value-Driven Strategies are crucial. The standout performers in October were the fast casual and quick service segments. This is aligned with brands’ push to emphasize value and competitive price points.


Thanksgiving Calendar Impact on November’s Numbers

The Thanksgiving holiday was late during the month this year. It fell into December, according to our standardized reporting calendar.

Typically, this is when restaurants close completely or operate under reduced hours. It also means work, school, and other routines get disrupted, and families likely gather for a meal at home instead of eating out.

The calendar shift artificially boosted November 2024’s numbers. Additionally, it means the holiday’s disruptive effects were excluded.

Shift Calendar Adjustments and a Combined Comprehensive View of November and December

December’s sales and traffic data may appear weak at first glance. However, a deeper dive reveals a more interesting story.

To account for the calendar shift, it’s vital to view the last two months as a combined period for sales and traffic.

November and December combined saw a strong 1.1% in same-store sales growth.

Jan.
Feb.
Mar.
Apr.
May
Jun.
Jul.
Aug.
Sept.
Oct.
Nov.
Dec.

As we look back on 2024 restaurant industry trends, it’s clear that resilience and strategic agility have been the hallmarks of high-performing restaurant brands.

At Black Box Intelligence, we help brands stay ahead of trends and make proactive decisions with our monthly Out of the Box and Monthly Second Helping blogs series.

By leveraging 2024 restaurant industry trends, you can ensure 2025 starts off strong and builds on a foundation of growth.

To get the full monthly breakdown, check out our Out Of The Box back catalog:

Review all the data breakdowns BBI has done throughout the year

Dive into more data from 2024