Financial Intelligence for Restaurants
The Most Trusted Restaurant Sales & Traffic Benchmarks – So You Know Fast: Is It You or the Market?
Get access to the industry’s most trusted restaurant sales benchmarks from the Restaurant Performance Network – deep, proprietary sales and traffic performance metrics that come straight from restaurant brands.
Turn data into direction and insight into action.

30+ Years Serving the Biggest Names in the Restaurant Industry


The Financial Intelligence Experience
Black Box Financial Intelligence Product Tour
Restaurant Sales and Traffic Benchmarks
Why the C-Suite and Finance Teams Trust Black Box Intelligence
Whether you’re managing 30 or 3,000 locations, Black Box Financial Intelligence gives you the data clarity and market visibility to lead with confidence. Restaurant sales and traffic benchmarks designed to propel you to your maximum potential.


Use Cases
How Leading Brands Use Black Box Financial Intelligence
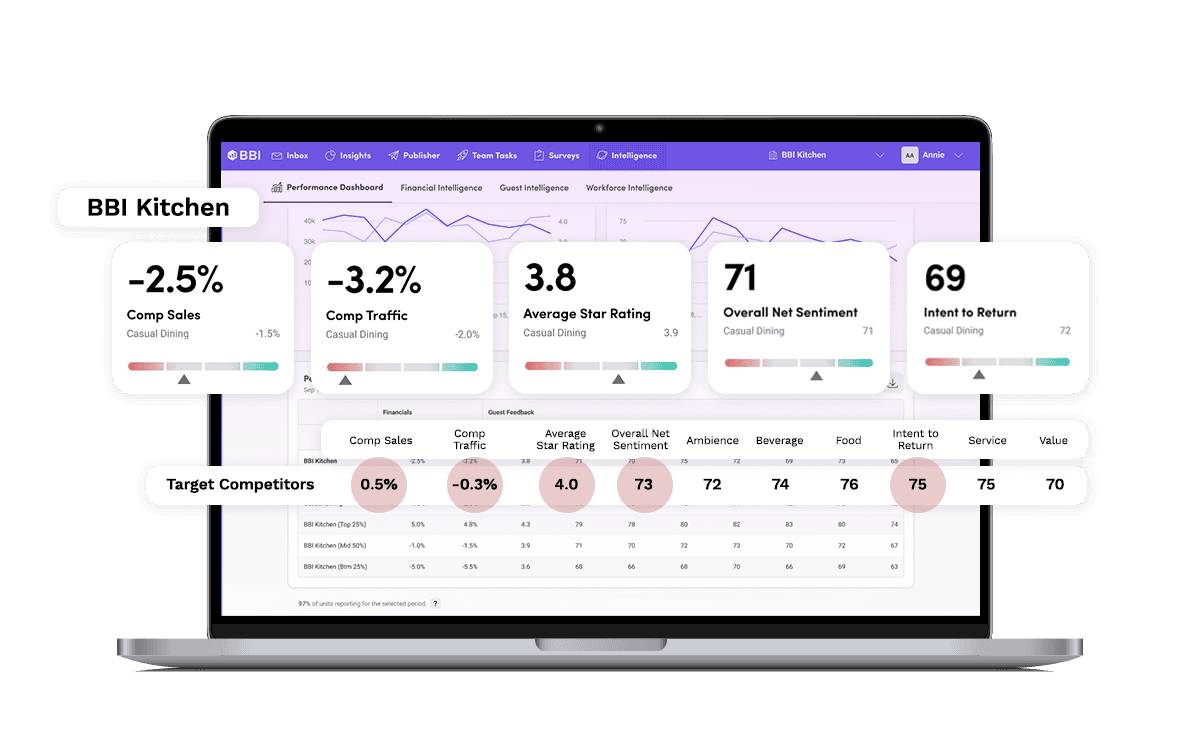
Restaurant Sales and Traffic Intelligence
Definitive Traffic and Sales Insight for Restaurants
Understand sales and traffic performance with interactive and customizable dashboards that enable you to uncover exactly what’s impacting your numbers over time.
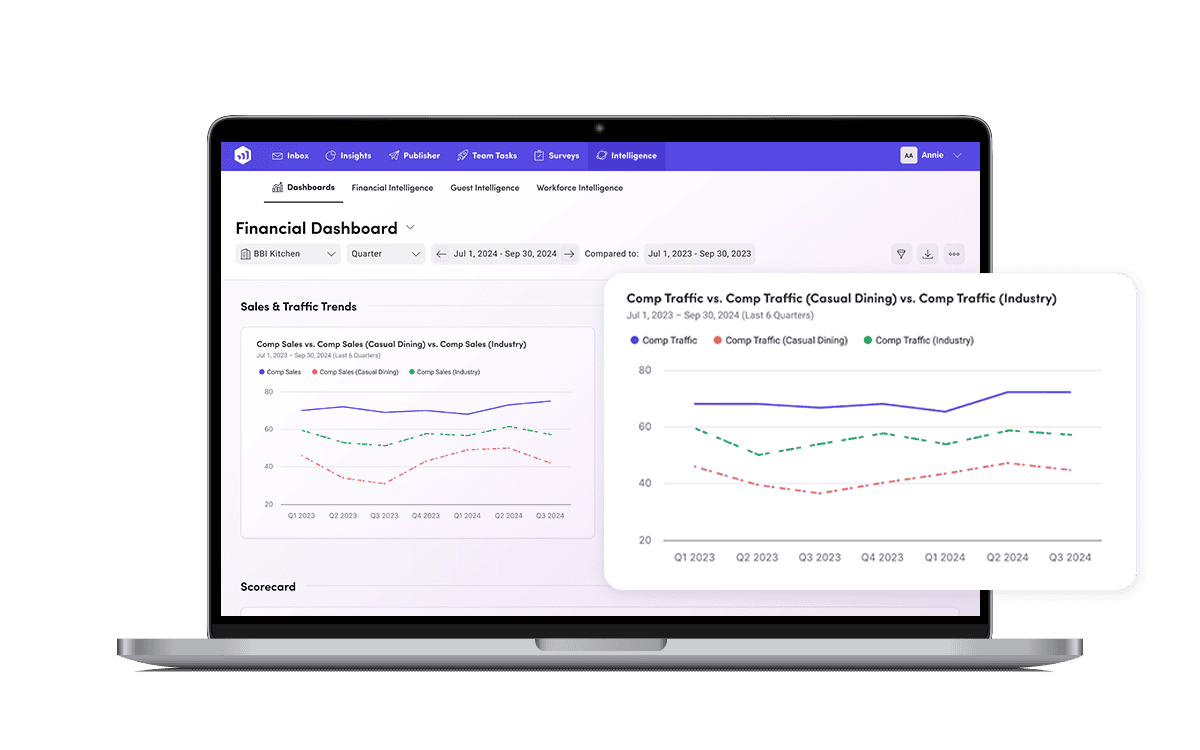
Our traffic and sales benchmarks are updated daily, which makes them the most-up-to-date financial market comps available.
Restaurant Sales and Traffic Intelligence
Deepest Sales and Traffic Comps

Sales Channels & Revenue Centers
-
Off-Premise & On-Premise Sales (segmented by type – e.g. kiosk vs delivery vs pick up etc.)
-
3PD Sales

Beverage & Menu Mix
-
Food Sales Categorization (e.g. appetizer vs entree vs dessert)
-
Beverage Sales Categorization (e.g. liquor vs beer vs wine etc.)e

Traffic Metrics
-
Total Traffic
-
Check Count
-
Guest Count

Sales Types & Adjustments
-
Discounts
-
Comps
-
Other Sales Types

Performance & Productivity Metrics
-
PPA/PTA
-
Sales/Traffic Per Labor Hour
-
Traffic/Guest Per Labor Hour

Daypart
-
Meal (Breakfast vs Lunch vs Dinner)
-
Time of Day (Mid Afternoon vs Late Night etc.)
…and Much More
Unmatched Restaurant Sales and Traffic Benchmarks
Customize Sales and Traffic Comps You Need to Make Confident Decisions
-
Updated weekly, making them the most up-to-date source of traffic and sales benchmarks available.
-
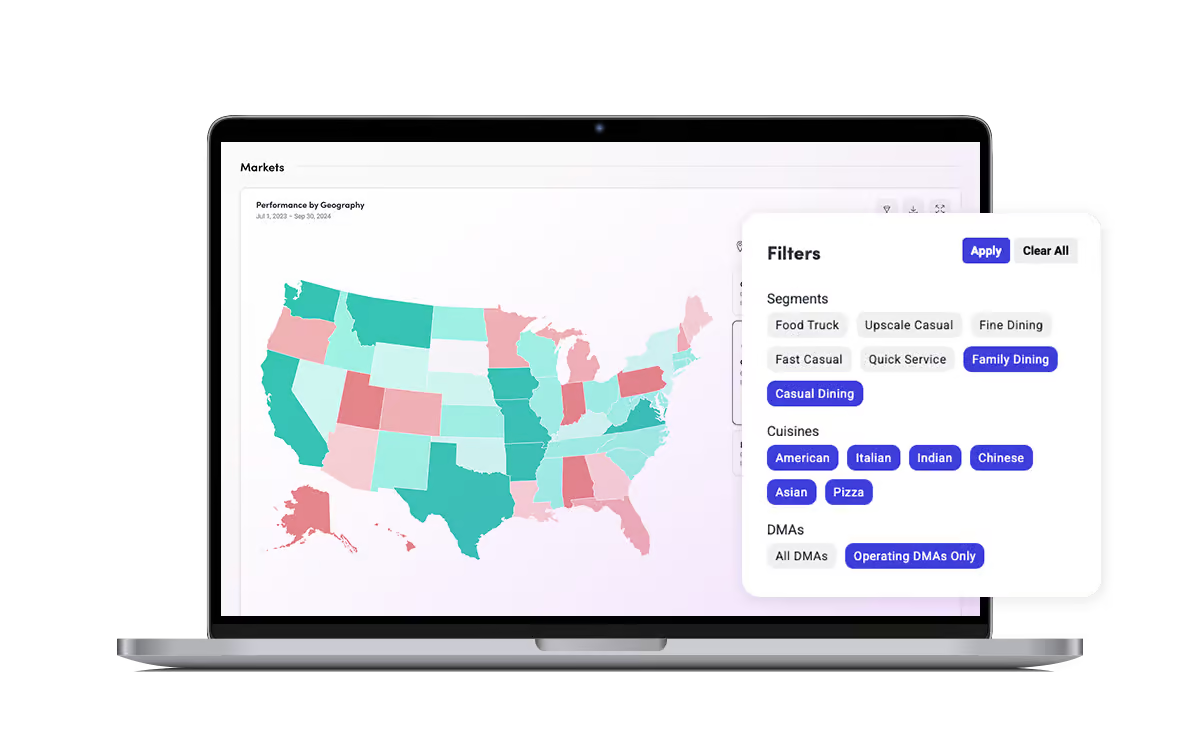
See your data against other restaurants by industry, segment, cuisine, or however you define “competition”.
-
Drill down into geographies, regions, Nielsen DMAs and units
-
Weekly, monthly, quarterly, and annual comparisons
“The use of Black Box has helped improve our overall performance in same store sales and guest counts. We share this data weekly with our operators and it pushes them to improve their performance.”
Mike Axiotis, President, Lehigh Valley Restaurant Group dba Red Robin


“We really enjoy your team and their insight. Your product has made us better operators and franchisors. Really helps to tell a story. Keep the intel coming.”
Joe Hummel, CEO Twin Peaks


“Black Box Financial Intelligence is now one of my NEW BESTIES! The Intelligence dashboard is so easy to navigate but insightful enough to be able engage on executive conversations and get perspective of actions we could take for the brand.”
Alejandra Gonzalez, Marketing Director, Brinker International

“I really like the competitor reporting. With our brand being in one of the smaller categories (Family Dining), it was very helpful for us to build a customized index that gives us more regional granularity.”
Gordie Galloway, Executive Director, Finance – Dine Brands


Gold Standard Restaurant Sales and Traffic Benchmarks
Powered by the Restaurant Performance Network
Benchmark against the industry’s most trusted dataset: complete, connected, and secure intelligence across guest, financial, and workforce performance.
Never again wonder: “Is it the market or…ME?”.

“We use Black Box Intelligence to stack rank potential franchisees as we look to expand. It really provides us with the agility to go to market effectively.”
Maria Rivera, CEO, Smalls Sliders

Black Box Intelligence Platform
Black Box Financial Intelligence Is Your Sales & Traffic Benchmarking Engine. Compound Value With the Rest of the BBI Platform.


Performance Intelligence
The Only Connected View of Guest, Financial, and Workforce Signals—See Why Results Changed and What to Do Next
The restaurant sales and traffic benchmarks provided by Black Box Financial Intelligence combines with the rest of our platform to fuel the AI Restaurant Performance Platform – Performance Intelligence.
-
Gain clarity on impact of turnover and compensation on financial performance.
-
Precisely size impact of guest experience and marketing promotions on sales and traffic.

Talk to us today!
Leave your contact details to learn more about our restaurant sales and traffic benchmarks and we’ll be in touch.