Guest Sentiment Measurement
Understand Every Guest Experience with Restaurant-Trained AI
Guest Sentiment Measurement – part of Reputation Hub – transforms scattered feedback into clear, actionable insights.
It analyzes every comment from your surveys, reviews, and social media – then distills it into restaurant-specific themes, while providing all the big picture aggregated metrics you need.
30+ Years Serving the Biggest Names in the Restaurant Industry


Powerful, Deep Guest Experience Sentiment Measurement
Instant Clarity on What’s Working, What’s Broken and What to Fix Next

Built Exclusively for Restaurants

Covers All Digital Channels

Fast, Scalable and Easy-to-Use
The Problem: Understanding Guest Sentiment Across Channels
One Place for All Restaurant Guest Sentiment Analysis
Analyzing guest feedback across surveys, online reviews, and social media is messy. Each channel speaks its own language, and without a way to bring it together, you lose time – and miss the message. Without a good way of breaking through the noise:
-
You can’t quantify what’s driving poor experiences.
-
You can’t prioritize action across locations.
-
You can’t accurately size the scale and impact of a problem.
The Solution: Guest Sentiment Measurement
Consolidate All Guest Feedback and Apply Restaurant-Trained AI to Surface Clear, Actionable Insights

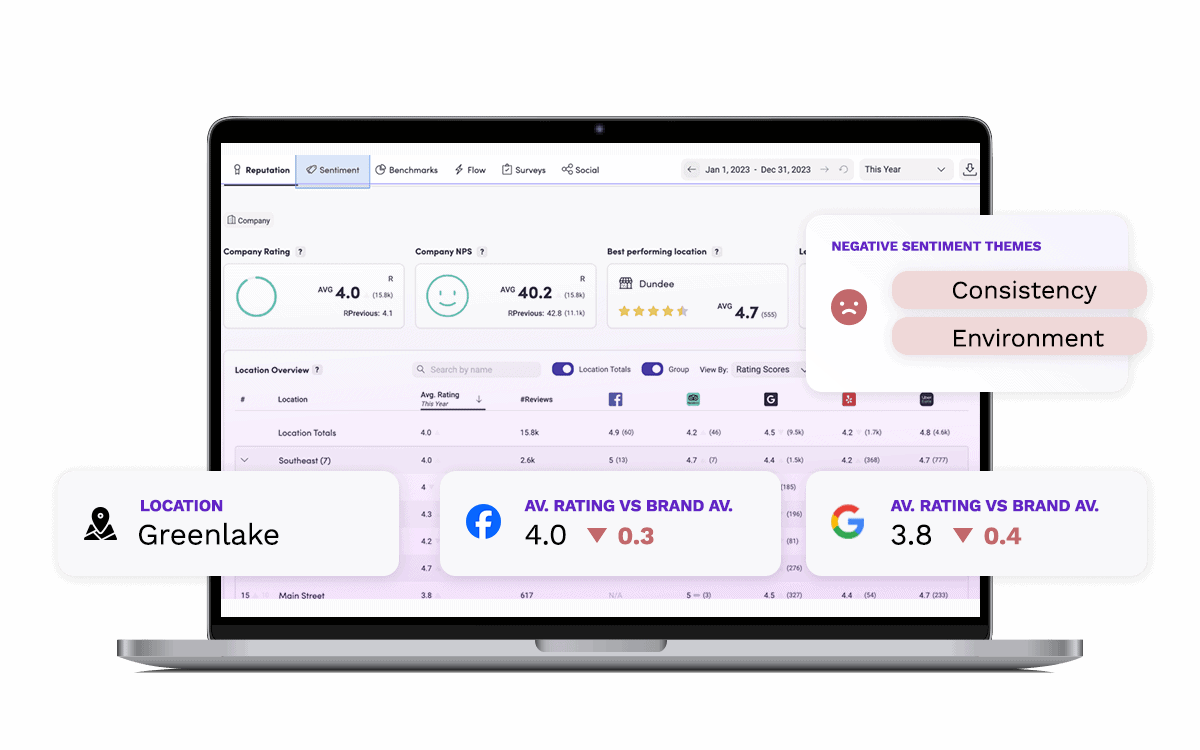
Aggregated Trends:
High-level metrics – such as Average Star Rating – segmented by channel, location and more.

Organized by Theme:
From “Food Quality” to “Service”, feedback is auto-grouped into restaurant categories.

Restaurant AI:
Trained on millions of real restaurant interactions for unmatched accuracy.

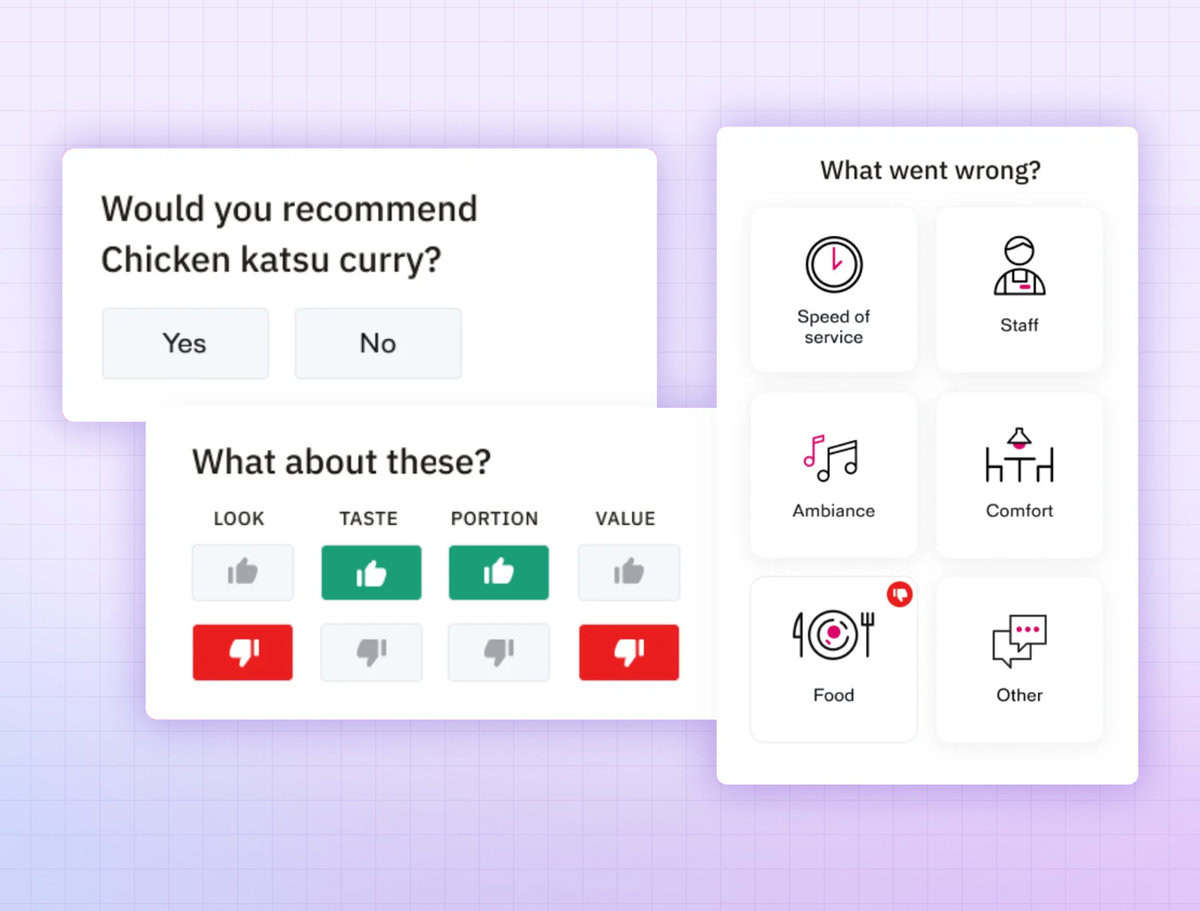
Drill Down to Verbatims:
See exactly what guests are saying and why it matters.
Guest Sentiment Measurement & Analysis
Restaurant-Specific Themes
AI-powered sentiment analytics trained specifically on restaurant feedback deep dives into sentiment around the key themes identified by our model as being critical to financial success.
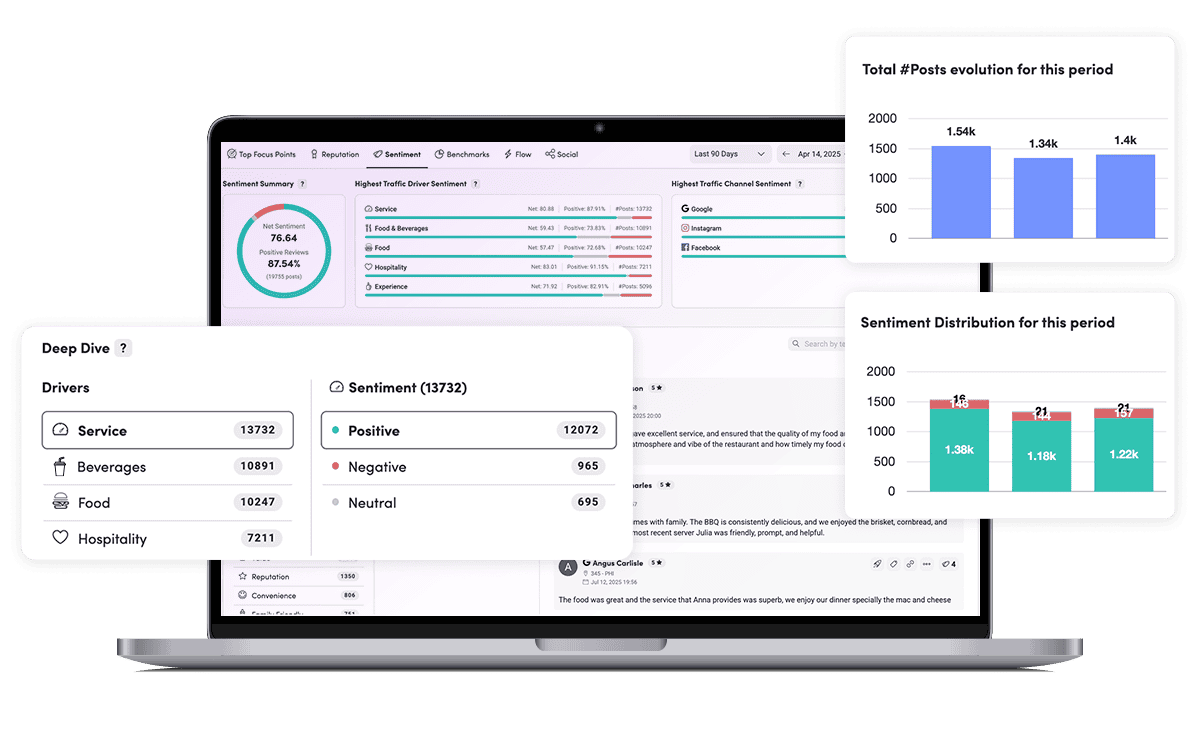
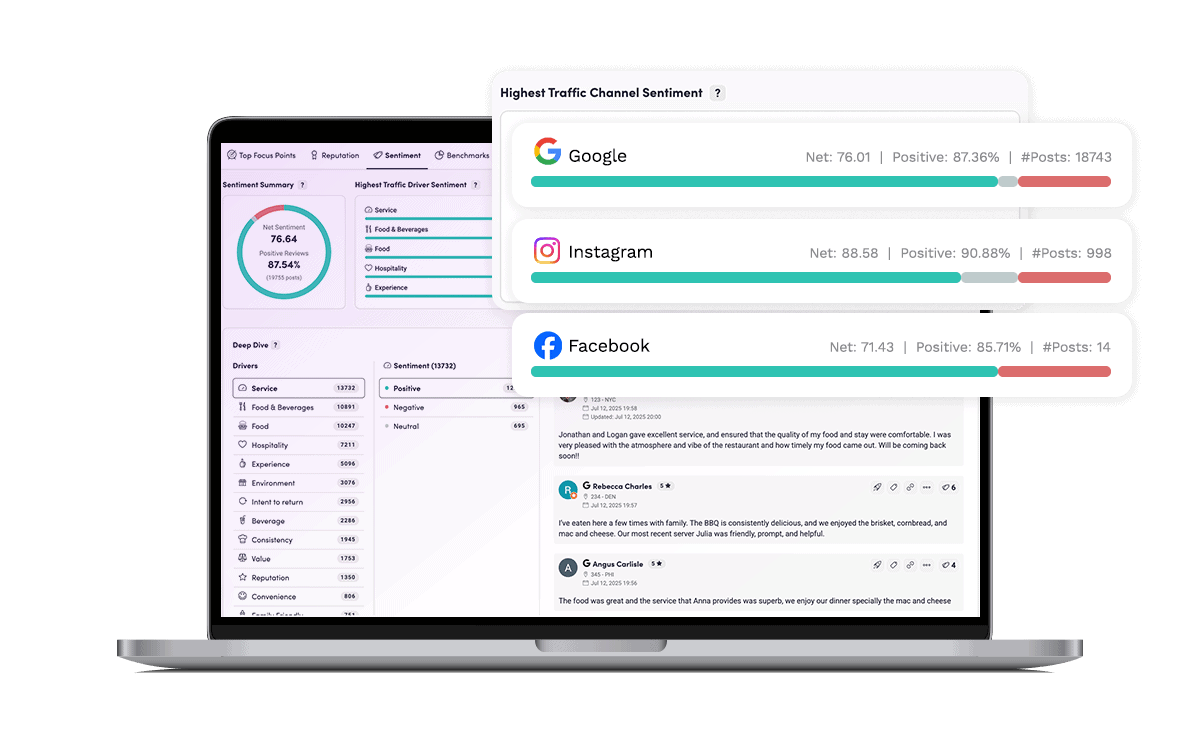
Cross-Channel Guest Sentiment Analysis
Channel Comparisons
Gain sentiment insight on each of the core review and social media channels.
Get the full picture of how you show up online.
Guest Sentiment ROI Calculator
What is the Tangible Dollar Value of Average Star Rating?
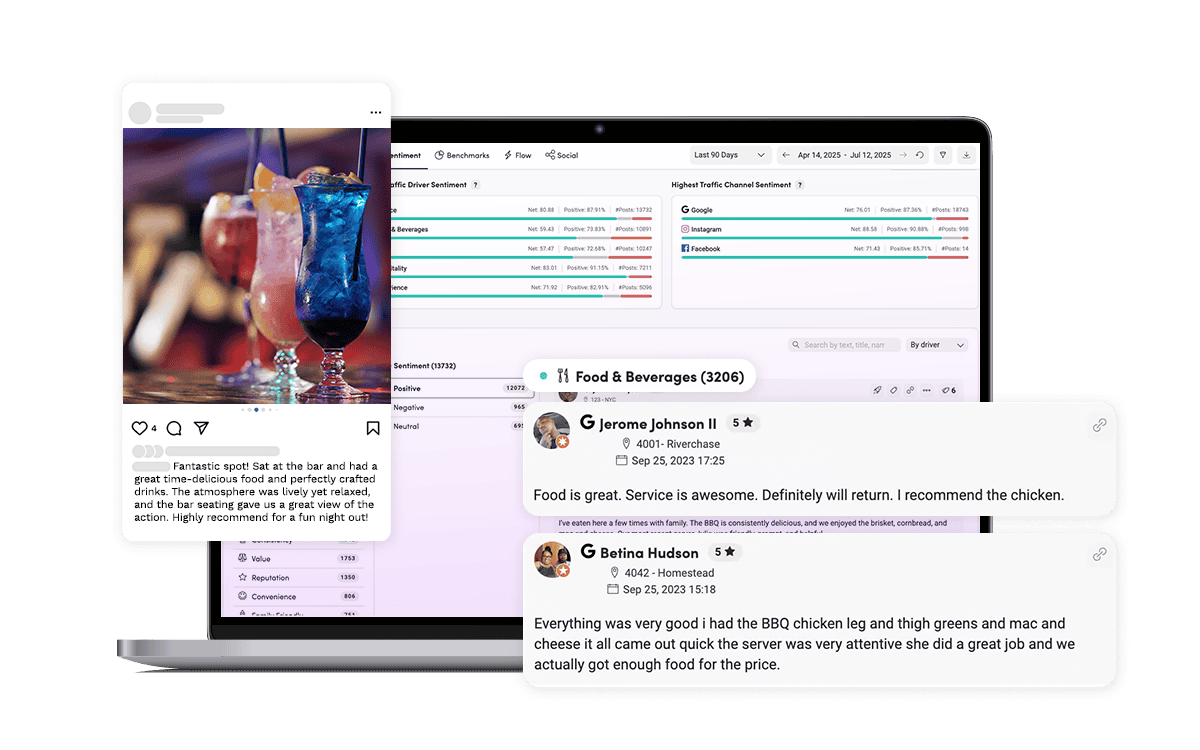
Detail-Rich Restaurant Guest Sentiment Analysis
Drill Down to Individual Reviews, Surveys and Posts
Gain important context by drilling down to individual review verbatims from the top-level sentiment drivers.
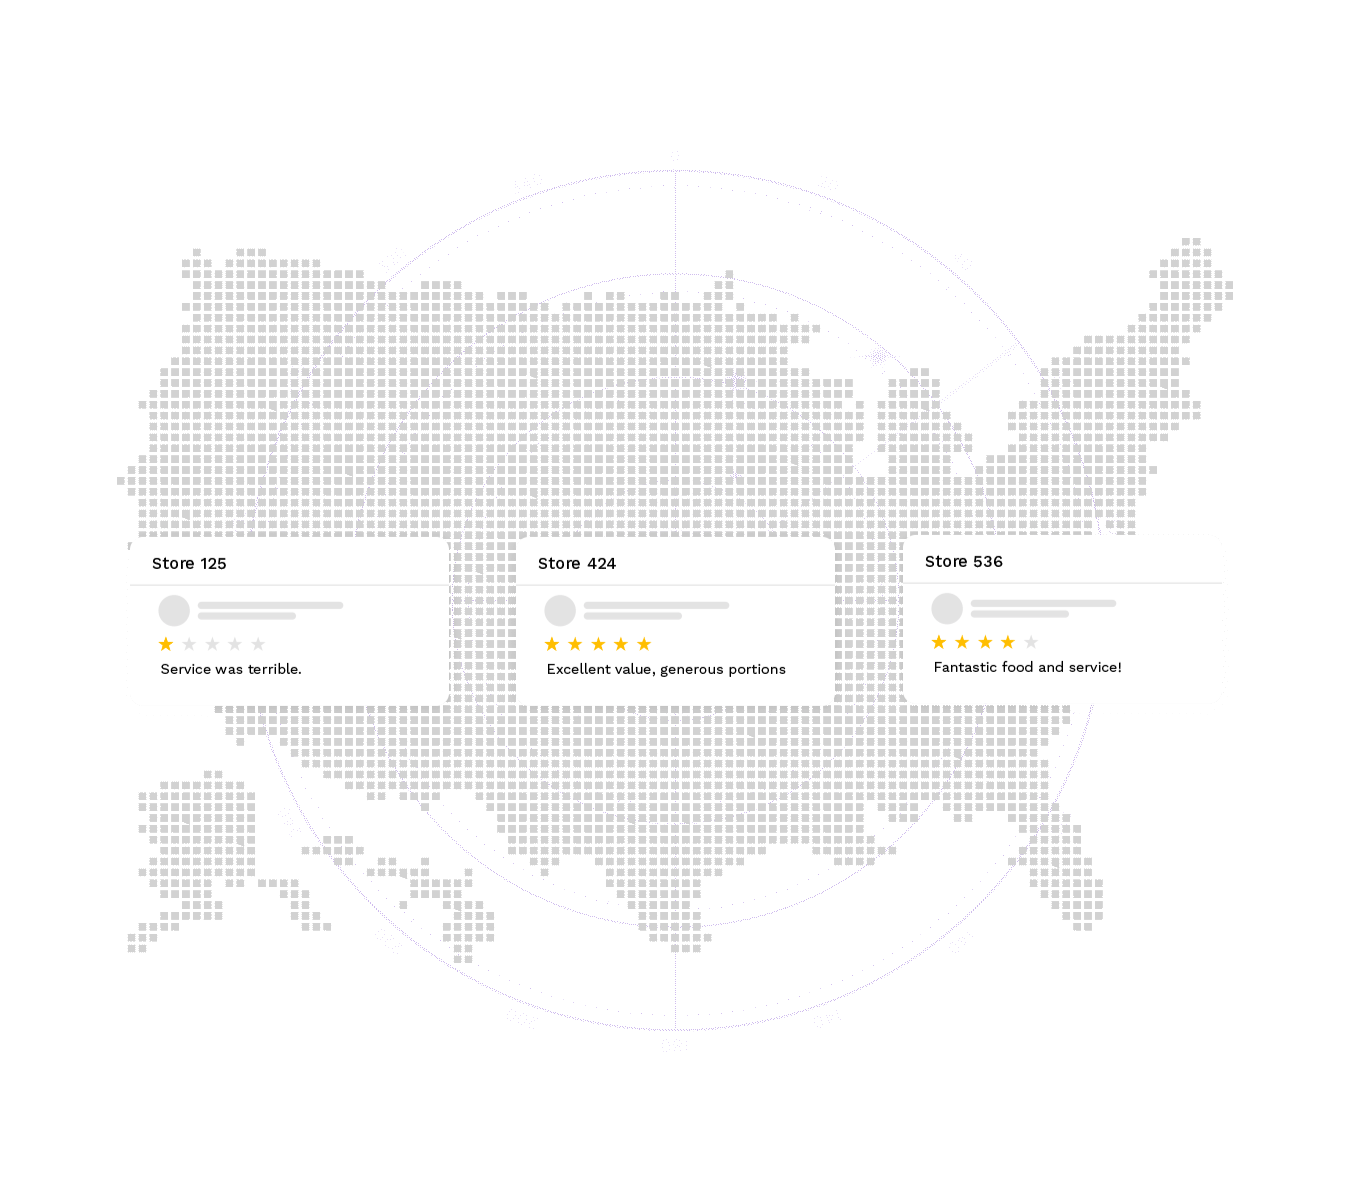
Location-Specific Restaurant Guest Sentiment Measurement
Compare Across Locations
Make geographic comparisons drilling down to individual unit performance. Incorporate top line metrics like Average Star Rating, sentiment and theme of the verbatims and more.

“It’s so awesome to see our teams come together around this data, make an actionable game plan and then make a change.”
Destinee Rollins, VP of Marketing, Twin Peaks

Restaurant Guest Sentiment Measurement Platform
Explore Reputation Hub


Guest Experience Management Platform for Restaurants
Reputation Hub is a Key Pillar of a Bigger, Holistic Guest Experience Platform
Integrations
Connect with tools you already use to collect more and better feedback.
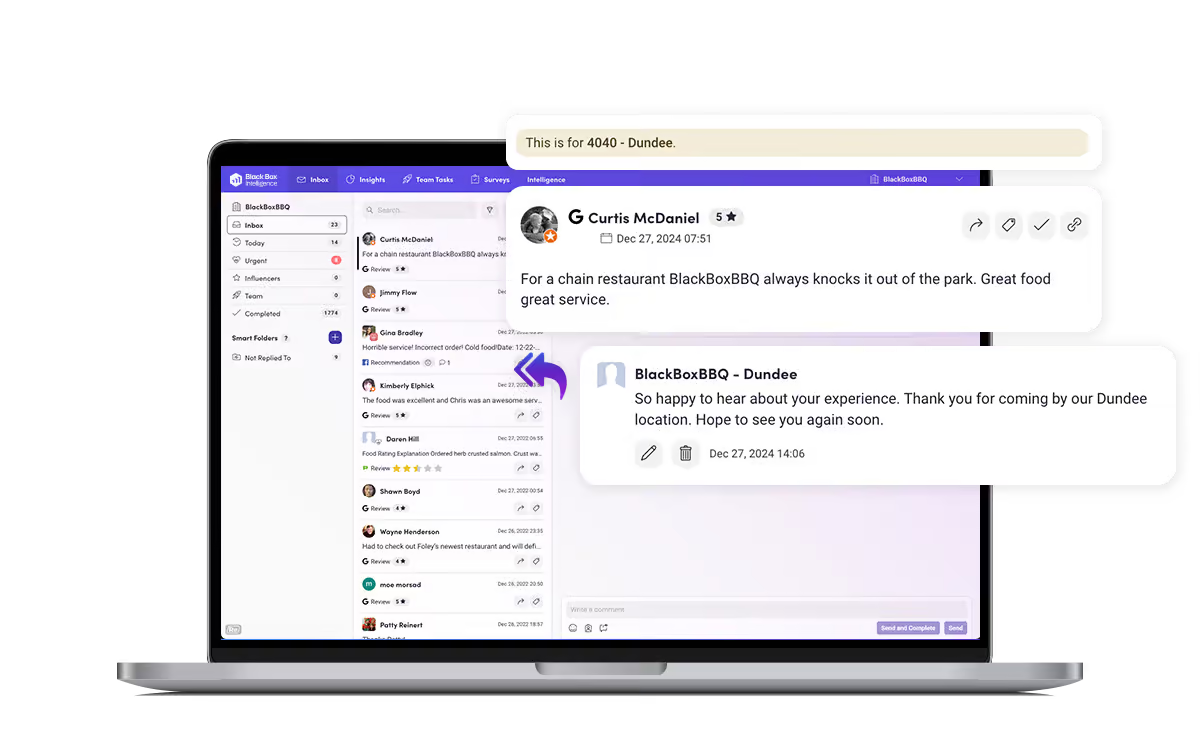
Reputation Management
Engage direct with guests across all digital channels and orchestrate action across your system.
Performance Intelligence
Fueling the AI Restaurant Command Center With Unrivaled Guest Experience Insights
Guest Sentiment is even more powerful when paired with our Performance Intelligence platform.
By combining guest feedback with your sales and traffic data, you can:
-
Quantify the business impact of guest experience.
-
Identify experience drivers behind unit performance.
-
Prioritize high-ROI improvements.

Talk to us today!
Leave your contact details and we’ll get in touch to discuss how we can help.