State of Restaurant Workforce

Employee Turnover

Turnover is where P&L, guest experience, and culture collide. Even as hourly churn improves from pandemic-era highs, management stability has not fully recovered. The direct replacement costs are steep and the indirect traffic penalty is real—particularly when FOH or BOH turnover is high.

Employee Turnover Trends Since 2019

Hourly turnover easing, but management turnover remains high.

Turnover Overview (2019 – 2025)
Bar charts comparing turnover rates for hourly and management employees in limited-service and full-service restaurants from 2019 to 2025 Q3, showing a general decline in turnover over time across both segments.
© 2025 Black Box Intelligence. Research proprietary to BBI and exclusive to BBI. NOT FOR REDISTRIBUTION​
What the Data Says
  • In limited service, hourly turnover continues to fall from 133% (2019) to 110% (2025 Q3) on a rolling-12 basis.

  • In full service, hourly turnover improved from 101% (2019) and has held at ~92% (2025 Q1–Q3) through this year.

  • Management churn is still elevated: limited service runs ~44–47% through 2024–2025 with little movement.

  • Full-service management turnover has eased from 41% (2024 Q3) to 35% (2025 Q3) but remains well above pre-pandemic lows.

  • The gap between improving hourly stability and stubborn manager churn is now the biggest retention risk.

  • Recommendation: Make GM and manager tenure a top-line KPI; set explicit quarterly targets for time-to-backfill and bench depth, and trigger retention actions (schedule relief, spot retention bonuses) when thresholds are hit.

Cost of Turnover

The hard costs of turnover are now higher than they’ve ever been.


Hard costs (separation, replacement, and training)
associated with replacing a single employee
$2,706
Restaurant Hourly
(compared to $2.3k in 2024)
$11,940
Manager Non-GM
(compared to $10.5k in 2024)
$17,651
General Manager
(compared to $16.7k in 2024)
Training costs represent about 35% of the total for restaurant hourly employees, 53% for non-GM restaurant managers, and 54% for General Managers.
With 1,000 hourly employees and 100% turnover, turnover costs:
$2,700,00
What the Data Says
  • Replacing a restaurant hourly employee costs about $2,706 in hard dollars (separation, replacement, training).

  • Replacing a non-GM manager costs about $11,940, and replacing a GM costs about $17,651.

  • Training is a major driver: roughly 35% of hourly replacement cost and 53–54% for managers/GMs.

  • Even small reductions in manager/GM churn yield outsized savings compared with hourly exits.

  • Recommendation: Redirect a portion of turnover spend into preventative investments—manager pipelines, leadership development, and targeted retention bonuses—where each avoided exit saves five figures.

Hourly Staff Turnover Impact on  Sales and Traffic

The data doesn’t lie: lower turnover means better financial performance.


Difference in Comp Traffic Growth Relative to Peers:
Top Quartile Companies vs Rest Based on Hourly Turnover Rates
+1.7%
Full Service: Back of House
+2.6%
Full Service: Front of House
+0.5%
Limited Service: Team/Crew
What the Data Says
  • Brands with top-quartile FOH turnover (i.e., lower churn) in full service run +2.6% higher comp traffic than peers.

  • Brands with top-quartile BOH turnover in full service run +1.7% higher comp traffic than peers.

  • In limited service, top-quartile crew turnover is associated with +0.5% better comp traffic.

  • Lower hourly churn shows up quickly in table turns, accuracy, and recovery—protecting repeat visits.

  • Recommendation: Treat FOH/BOH retention as a demand lever: set FOH/BOH turnover targets on the weekly scorecard and fund the training/scheduling moves that keep those rates in the top quartile.

Measures to Reduce Turnover

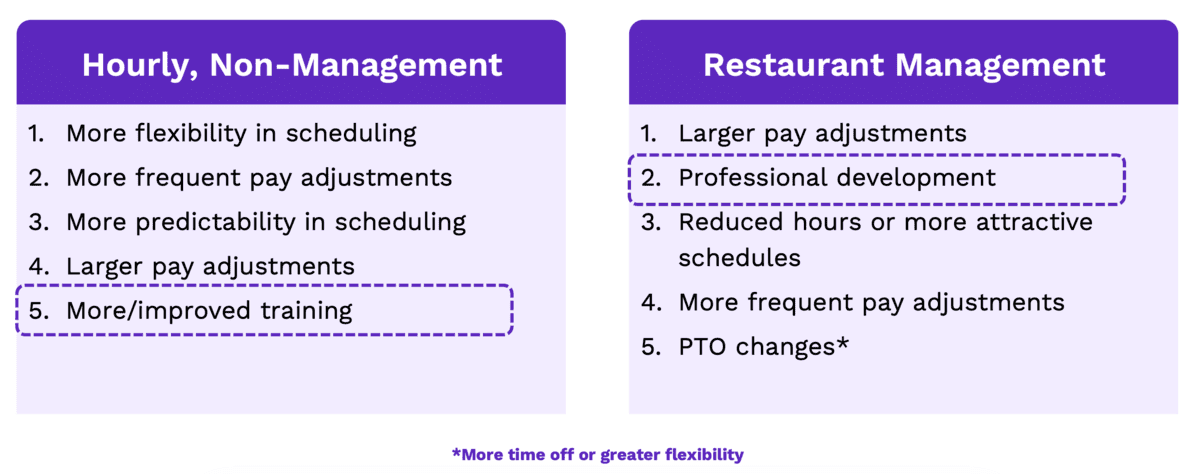
According to our research, compensation and benefits are major factors in staff retention. But it’s far from the only factor.

Many of the themes are about having the opportunity to be successful in personal life: specifically flexibility and predictability in schedule.

But what’s interesting is that staff also want the tools to be successful at work. One of the primary reasons hourly, non management employees are leaving their jobs is lack of training, and for managers a key factor for moving on is the feeling that they are not growing toward the next career level.


Most Effective Methods to Reduce Turnover
Comparison table showing top five employee requests. Hourly, non-management: scheduling flexibility, frequent pay adjustments, predictable schedules, larger pay, improved training. Restaurant management: pay, professional development, better hours, frequent pay, PTO.
© 2025 Black Box Intelligence. Research proprietary to BBI and exclusive to BBI. NOT FOR REDISTRIBUTION​
What the Data Says
  • For hourly, non-management, the strongest levers are more scheduling flexibility, more frequent pay adjustments, more predictable schedules, larger pay adjustments, and more/better training.

  • For restaurant management, the strongest levers are larger pay adjustments, professional development, reduced/more attractive hours, more frequent pay adjustments, and PTO changes.

  • Levers that increase time-off or flexibility matter across both groups, but managers additionally respond to development and hours quality.

  • Pay cadence (how often you adjust), not just pay level, is a repeat driver of retention at both levels.

  • Recommendation: Productize your retention stack: codify flexible scheduling + predictable rosters for hourly, pair with quarterly micro-merit and formal development paths for managers, and audit adoption location-by-location.

What Winning Brands Are Doing

  • Make GM stability a top KPI. Track GM tenure, internal bench depth, and time-to-backfill; intervene early with schedule relief and targeted retention bonuses.

  • Productize flexibility at the hourly level. Offer predictable schedules, more flexible shift swaps, and mid-cycle pay adjustments to cut turnover.

  • Move on comp cadence, not just comp levels. Pair annual merit with more frequent, smaller adjustments tied to skill stacking and performance.

  • Invest where the ROI is clearest. Fund professional development for managers, and increase PTO and more attractive hours in high-stress locations to defend tenure.

  • Overweight FOH and BOH training. Standardize day-one orientation and ongoing refreshers; the traffic lift from lower FOH/BOH churn justifies the training line item.

State of the Workforce Webinar

Where This Data Came From

Everything cited here was originally shared in our annual deep dive webinar into the state of the restaurant workforce, which was taken from our Total Rewards Survey and our Restaurant Performance Network – meaning all insight comes straight from the HR teams and payroll platforms of the biggest restaurant brands in the country.

A network diagram featuring the BBI (Restaurant Performance Network) logo at the center, connecting various restaurant logos—including McDonald’s, Denny’s, The Cheesecake Factory, and more—to highlight Restaurant Sales and Traffic Benchmarks.
[BBI-CP v17] Initializing...
// which jQuery executes when appended to #gform_24, redefining // window.gformRedirect to a NEW closure. Our v14 wrapper is gone, then // the very next line calls gformRedirect() and the page navigates BEFORE // the user can interact with the CP modal. // // v15 fixes: // 1. Hard-lock window.gformRedirect with non-configurable defineProperty // that ignores ALL writes once flowActive=true. // 2. Wrap jQuery $.fn.append on the gform_24 wrapper to STRIP