Restaurant Guest Satisfaction Snapshot
April 2021 Restaurant Industry Snapshot
[Originally posted
In April 2021, the restaurant industry saw positive sales trends, but lingering traffic issues remained a challenge. This was driven by a focus on maintaining food quality and cleanliness while coping with a staffing shortage.

The industry achieved stronger 2-year sales for the second consecutive month in April. Same-store sales growth was 6.8% on a 2-year basis in April. This was an improvement of 4.6 percentage points from the 2.3% 2-year growth reported for March. This is optimistic news for the industry as April became the best month for restaurants. This was based on sales growth in over three years.
Sales have recovered to pre-pandemic levels. However, 2-year same-store traffic growth was -4.2% in April. Despite the 4.9 percentage point improvement, restaurant traffic growth is far from positive territory. Most restaurant sales growth is due to unusually large growth in average checks. The data suggests that sales improvements. Additionally, they’re supported by brands meeting or beating expectations of guests.
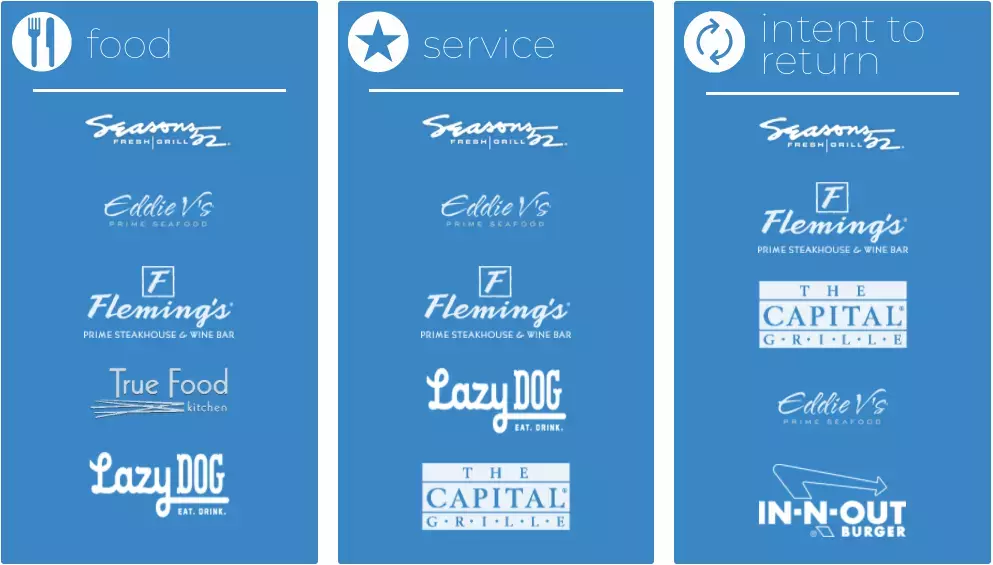
The percentage of positive restaurant online reviews and comments primarily centered around “food” improved by 8 percentage points compared to April 2019. Furthermore, since August 2020, over 50% of all food-centered reviews were classified as positive. This was for each month after a significant dip at the beginning of the pandemic.
Similarly, the percentage of positive reviews and comments centered around restaurant “service” improved by 5 percentage points over the last two years. Guests have been a bit more forgiving on “service” than “food”. It was only from March through April 2020 that less than 50% of service-centered reviews and comments were classified as positive. Every month since June, over 50% of “service” reviews were classified as positive.
The strong sentiment on “food” and “service” notwithstanding, guests are not as enthusiastic about their “intent to return” as they were two years ago. Reviews based on guest “intent to return” became less positive by 1.3 percentage points compared to April 2019.
Connecting the Dots on Performance
Challenges and Cleanliness: Navigating the Restaurant Industry’s Path to Recovery
Challenges and Cleanliness: Navigating the Restaurant Industry’s Path to Recovery
Sales and traffic improved during the first quarter, especially compared to Q4 2020. Restaurants faced increased challenges to execution. This notably the case in regards to staffing shortage confronting the industry.
More people are venturing out to restaurants. And that means juggling the dine-in traffic and off-premise orders that continue to capture a large share of all sales.
What Full-Service is Seeing
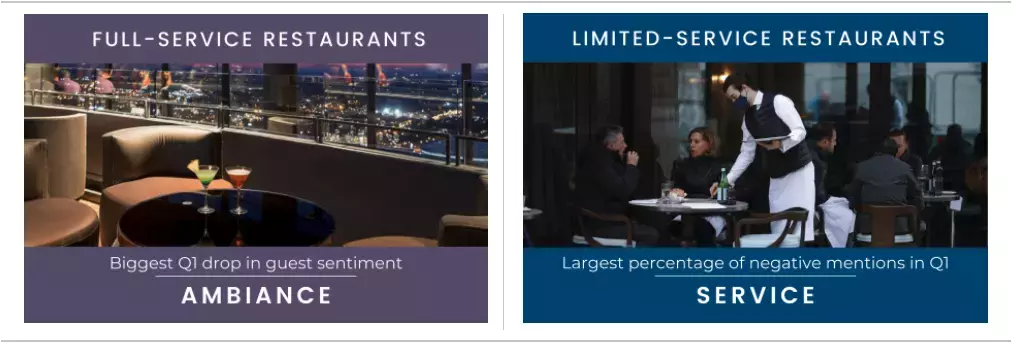
Full-service restaurants (FSR) rely much more on the dine-in experience than their limited-service counterparts. This means FSR brand’s traffic improvements during the first three months of the year came with an erosion of “ambiance” net sentiment. This is compared to the previous quarter.
A key factor in this decline in “ambiance” sentiment in FSRs seem to be based on perception of how clean a location is. “Cleanliness” suffered a drop in its net sentiment* of almost 10 percentage points compared to Q4 2020. “Cleanliness” comments often focused on surfaces such as tables and floors, high-contact items like plates, cups, and silverware, as well as the restroom.
In many cases, guests made a point of voicing their expectations of “clean”. This is heightened due to the pandemic. Additionally, if guests thought a location was unclean… they also thought it was a sign of bigger issues throughout the restaurant.
What Limited-Service is Seeing
For limited-service restaurants (LSR), we’ve seen much better sales and traffic performance. This is despite the pandemic. However, we continue to see dine-in sales down by a larger margin, Q1 of 2021 did not represent as big of a ramp-up in terms of execution. As a result, LSRs suffered less of a negative impact on their net sentiment during the quarter.
LSRs continued facing incredibly low net sentiment based on “service”. “Service” had the largest percentage of negative mentions in limited service during the quarter (the other attributes measured are “food”, “beverage”, “ambiance” and “value”).
Common negative mentions related to “service” in LSR include specific staff members who were rude or had bad attitudes. Another sore spot was the speed of service. Guests commonly complain about unusually long wait times. In many other cases, guests were not as nuanced in their descriptions. They simply complained of plain and simple “bad service”. With most restaurants operating with less staff than their pre-COVID norms, it’s unsurprising to hear that employees simply are unable to deliver prompt, friendly service every time.
Top DMAs
- Food- Orlando, FL
- Service- Orlando, FL
- Intent to Return- Orlando, FL
- Beverage- New York, NY
- Ambiance- New York, NY
- Value- Orlando, FL
Bottom DMAs
- Food- Atlanta, GA
- Service- Atlanta, GA
- Intent to Return- Atlanta, GA
- Beverage- Raleigh, NC
- Ambiance- Nashville, TN
- Value- Raleigh, NC
As is common, Orlando retained its position at the top of guest sentiment among the largest markets in the country based on many of the attributes of the restaurant experience. During April, Orlando’s restaurant guests expressed the most positive sentiment based on restaurant “food”, “service”, “value” and “intent to return”. This market is also one of the top performing based on same-store traffic growth over the last three months.
Among the strongest in “food” sentiment during April were Tampa, Sacramento, Denver, and New York. New York’s restaurant sentiment has emerged as extremely positive after the pandemic, after not being strong in the period before COVID-19. During April the New York DMA had the most positive sentiment based on restaurant “beverage” and “ambiance”. It was also among the top 4 markets in the country based on restaurant “value” and “intent to return” during the month. This recent positivity bodes well for restaurants in New York, which were hit hard by the pandemic.
COVID also continues to have an impact on restaurants in “ambiance”, especially as it relates to “cleanliness”. The 5 DMAs in the country that have had the biggest losses in restaurant traffic compared to the same period in 2019 are San Francisco, Sacramento, Los Angeles, New York, and Boston. These are large metropolitan areas that were among the most negatively impacted by the virus. But restaurant operators there have largely taken the right measures to keep employees and guests safe, and people visiting their establishments have noticed and voiced their approval. These five DMAs are also among the top 8 markets with the most positive “ambiance” guest sentiment during April. As we have been pointing out throughout the last year, “clean” remains the new “ambiance”.
The Restaurant Guest Satisfaction Snapshot (RGSS) is produced by data from Black Box Guest Intelligence™. Guest Intelligence is tracking over 190 brands to benchmark customer satisfaction and is the only online tool that integrates with operational performance data to validate the impact on financial performance. The data set focuses on six key attributes of the restaurant industry experience: food, service, ambiance, beverage, value, and intent to return.
The RGSS algorithm determines the highest-ranking brands based on sentiment. Brands included in this monthly snapshot must have a total of at least 250 mentions for the month. Restaurants must have a minimum number of units to be eligible as well. DMA rankings consider only the largest 25 areas.
Black Box Intelligence™ (formerly TDn2K) is the leading data and insights provider of workforce, guest, consumer, and financial performance benchmarks for the hospitality industry. The Black Box Intelligence product suite is the industry standard for operators seeking to achieve best-in-class performance results. With the largest and most reliable set of real restaurant data in the marketplace, Black Box Intelligence currently tracks and analyzes nearly 300 brands, 2.4 million employees, 50,000 restaurant units, and $76 billion in annual sales revenue. Black Box Intelligence is also the producer of the Best Practices Awards.