Restaurant Industry Snapshot™ – February 2021
Industry Comp Sales & Traffic
The restaurant industry was impacted by severe winter weather that wreaked havoc over much of the country in February. As a result, comp sales during the second and third weeks averaged -14.9% for the industry. Nonetheless, same-store sales growth for the first and fourth week of the month averaged -9.1%. Even though this represents a decline from January same-store sales growth, recovery is still indicated from the larger drops reported in late 2020.
Much of the sales performance can be attributed to rising guest check growth. Check growth grew by a larger margin for limited-service restaurants compared to full-service; however, most segments are experiencing growth in guest spending that surpasses pre-COVID months.
Regional & Market Performance

The restaurant industry was impacted by severe winter weather that wreaked havoc over much of the country in February. As a result, comp sales during the second and third weeks averaged -14.9% for the industry. Nonetheless, same-store sales growth for the first and fourth week of the month averaged -9.1%. Even though this represents a decline from January same-store sales growth, recovery is still indicated from the larger drops reported in late 2020.
Much of the sales performance can be attributed to rising guest check growth. Check growth grew by a larger margin for limited-service restaurants compared to full-service; however, most segments are experiencing growth in guest spending that surpasses pre-COVID months.
The Restaurant Workforce
Job Growth & Turnover

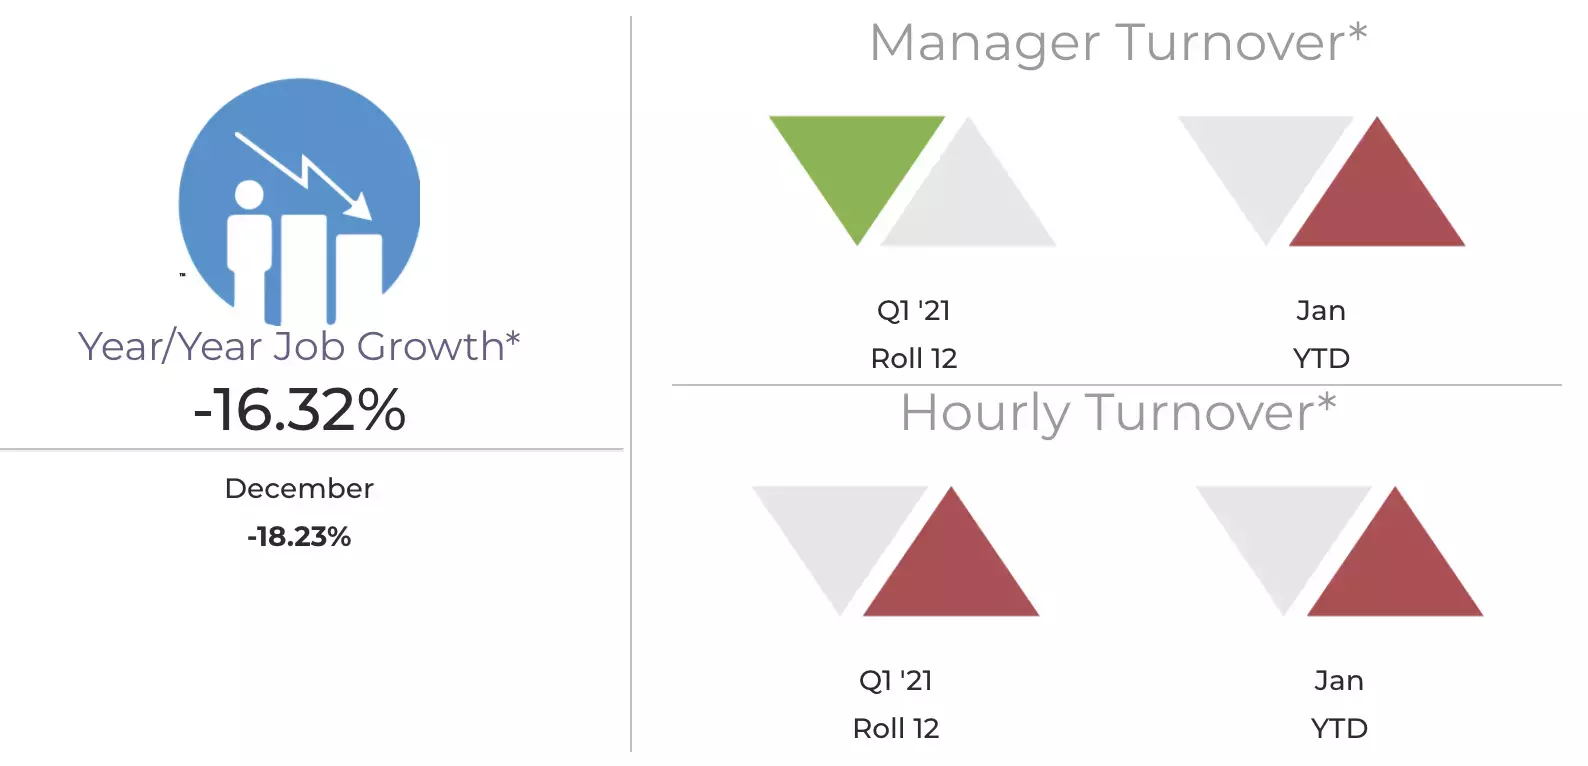
The total number of restaurant jobs increased in February, but there is still plenty of ground to cover to get to a recovery in terms of staffing. Turnover for hourly employees went up during January exacerbating the challenge.
Staffing levels still reflect the employment decline at the end of 2020, with the number of employees per restaurant decreasing again. Most of these staffing cuts are affecting full-service locations with the majority reflected in front-of-house.
Despite poor topline results for February, there are some reasons for restaurants to remain optimistic about the continued, albeit irregular, recovery of the industry. Same-store sales growth was a dismal -12.6%, a 7.8 percentage point drop from January. However, analyzing the month’s data at the weekly level reveals a slightly different story.
The weather was the biggest factor behind the poor results in February. The severe winter storms during the second and third weeks wreaked havoc in many large areas of the country not typically faced with this kind of weather. Same-store sales during the second and third weeks averaged -14.9%.
By contrast, same-store sales growth for the first and fourth week of the month averaged -9.1%. Although this average represents a decline from the -4.9% same-store sales growth recorded in January; it continues to show recovery for the industry from the double-digit drops in comp sales reported for late 2020.
Restaurant same-store traffic growth was -19.1% in February, a 7.0 percentage point drop compared to January and the worst for the industry since July. It was also the devastating effect of winter weather during the second and third weeks that is to blame for the traffic decline. Same-store traffic growth during the third week of February was -23.0%, the worst for the industry since mid-June.
Growth in Average Check Higher in 2021
Acceleration in average check growth has aided sales performance since the beginning of the pandemic. Late 2020 revealed guest check growth results of 6.5% in November and December. In 2021, growth is again on the rise. Average check growth in January was 7.6% followed by a strong 7.5% in February year over year.
Check growth in limited-service* restaurants grew by a much larger margin in February compared to check growth in full-service**. Both quick service and fast casual experienced a year-over-year increase in their average check of 10% or higher.
Most segments in full-service are experiencing year-over-year growth in spending per guest that surpasses what was recorded in previous years pre-COVID. For example, casual dining’s average spend per guest grew by 4.4% in February. The growth in spend per guest was only 2.4% for this segment in 2019.
*limited-service: quick service & fast casual segments
**Full-service: family, casual, upscale, and fine dining segments
Signs of Improvement for Fine Dining and Upscale Casual
All segments posted negative same-store sales growth in February, something we haven’t seen since last April when the industry was going through the most challenging period of the pandemic. But despite the February stumble, limited-service restaurants are outperforming the industry by a wide margin. Same-store sales growth for limited-service during the month was -2.9% compared to -19.5% for full-service restaurants.
In full-service, the best-performing segment is still casual dining. But there was some upward movement in fine dining and upscale casual. February was the best month for these two segments since October and was the only one that improved same-store sales growth results compared to January.
Off-Premise Sales Growth Tapering Off, Dine-In Recovery Continues
Dine-in sales year over year remain negative and got worse in February. Limited-service same-store dine-in sales results were -53.0%, a drop of 1.4 percentage points. Full-service dine-in sales were -36.7%, a decline of 3.2 percentage points.
Despite the weather challenges in February, dine-in sales growth for limited-service was 1.3 percentage points better than in December; full-service saw a stronger 6.1 percentage point improvement. Since the beginning of the year, consumers have been more willing to dine in at restaurants, perhaps the result of COVID cases declining, some dine-in restrictions being eased, and the vaccines starting to roll out.
Year-over-year growth in off-premise sales* for limited service was 16.6%, a drop of 6.9 percentage points compared to December. For full-service restaurants, same-store off-premise sales growth was 97.3% during February, a 15.6 percentage point drop compared to December. Despite the latest shifts, it is important to note that this is a tapering off from the substantially elevated off-premise sales growth rates experienced over the last 11 months. The growth rate may be slowing down, but restaurants continue relying heavily on off-premise.
*Off-premise defined as to-go (takeout), delivery, and drive-thru where applicable.
Alcohol Sales Still Down Over 30%
A consequence of full-service dine-in sales being at historically low levels is that sales of alcoholic beverages continue to suffer bigger losses than food sales. In February, same-store alcoholic beverage sales were down by 33.0% year over year; food sales fell by just 17.1% during the month. However, there is some positive momentum in alcohol sales. Alcoholic beverage sales were down by 40% year over year in December, but year-to-date results show full-service alcohol sales improving to -32.7%.
Top Performing Dayparts Still Not Posting Positive Results
Mid-afternoon remains the best-performing daypart but still was not able to post positive year-over-year sales growth. The mid-afternoon has been that top performing daypart since April of last year. Late-night remains the worst performing daypart by a large margin. Restaurants lost over 30% of their sales year over year for this daypart in February.
While the breakfast daypart had some challenges earlier in the pandemic, it was the second-best performing daypart based on sales growth in February and has occupied that spot during 3 of the last 4 months.
Texas and the Southeast See Biggest Drops in Sales Growth
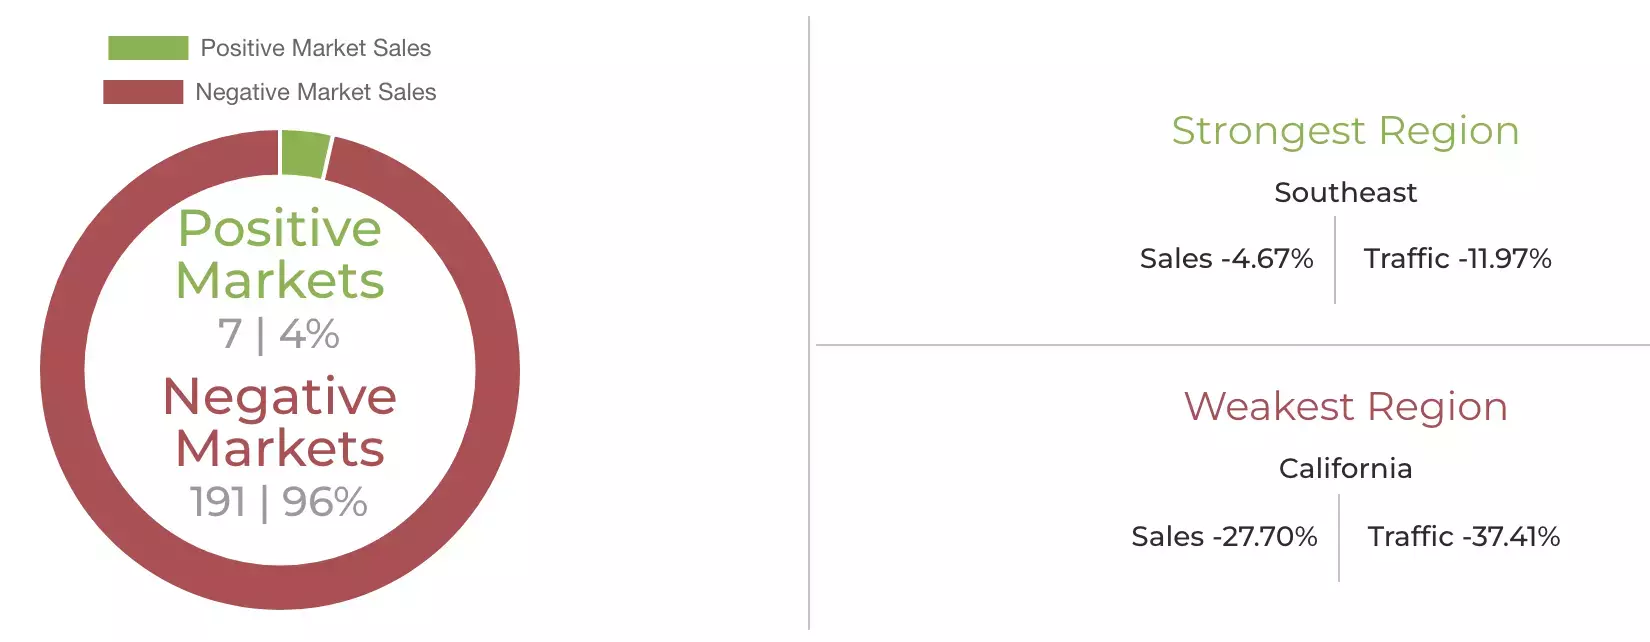
California* was the only region able to improve same-store sales performance during February. Meanwhile, the Southwest and Texas experienced the biggest declines in same-store sales, both posting a drop of about 16 percentage points compared to January. Same-store sales during the third week of February were down more than 40% year over year in Texas, while the decline in the Southwest was close to 30%.
The best-performing regions based on year-over-year sales growth during the month were the Southeast, Florida, Mountain Plains, and the Midwest. The worst-performing regions were California, New England, New York-New Jersey, and Texas. Despite improving from January’s year-over-year growth rate, California remains the worst-performing region of the country. Only two states (Idaho and Utah) were able to achieve positive same-store sales growth during February, and 15 states were positive in January.
The states with the biggest losses in same-store sales during February were New Mexico, California, Washington, Oregon, Massachusetts, New Jersey, Connecticut and Texas. The District of Columbia would qualify as the worst-performing state based on restaurant sales growth during the month.
*California, Texas, and Florida are classified both as regions and states in Black Box Intelligence’s reporting due to their large market size.
Biggest Improvement in Restaurant Employment Since August
The restaurant industry’s total employment shrunk again in November and December posting modest gains of 17,000 jobs in January*. But as dining restrictions eased and consumer optimism fueled an increase in restaurant sales since the beginning of the year, restaurant employment is also showing signs of increased recovery.
Total number of jobs in the industry increased by a robust 286,000 in February, the strongest jump since August. Despite the increase, the industry’s workforce is still far from a full recovery. As of February, there were over 2 million fewer restaurant jobs than a year ago immediately before the pandemic hit.
According to the latest data from Black Box Workforce Intelligence™ staffing levels still reflect the decline in employment at the end of last year. The number of employees per restaurant decreased compared to where the industry was a few months ago. As would be expected given their larger sales losses and more plentiful staff, staffing cuts per restaurant locations continue to be much more pronounced among full-service restaurants. Within full-service, staffing cuts per location are over twice the amount for front-of-house employees than for those working in the back-of-the-house.
*According to the Bureau of Labor Statistics
Latest Indicators Predict Strong Economic Growth in 2021
Written by Joel Naroff, President of Naroff Economic Advisors
A few months can make and have made a major difference when it comes to the economy. At the end of 2020, it was uncertain if a third stimulus bill would be passed and if so, its size. Now we know it is large and that has raised forecasts of 2021 growth significantly. The key, for both the economy and the restaurant industry, is household income. The second (December) round of stimulus has hit and the January rise in disposable income was the second largest on record. The greatest was in April 2020 when the first round of stimulus funds was paid out.
The third round of checks would create an even larger total gain in income. Households are saving a major portion of the funds, which is good. Consumption should rise not just in the near term but into the future as well. In addition, the approval of a third vaccine makes it clear that the loosening of restrictions will accelerate through the spring. Economic growth in 2021 should be robust, possibly 4.5% or more, boosted by the size of the stimulus package and that bodes well for restaurant sales going forward.
Looking Ahead
Springtime, Stimulus Checks, and Hope: A Brighter Future for Restaurants
The outlook for the restaurant industry is healthier than it seemed at the beginning of the year. In the weeks immediately after the second round of stimulus checks, sales data indicated a boost of incremental income created for restaurants. There is plenty of pent-up consumer demand and those checks helped unleash that purchasing power.
With the third round of economic stimulus for consumers being approved and vaccination rates increasing every day, an acceleration in the pace of recovery for restaurants is expected in the next few months. Warmer weather is rapidly approaching, resuming the possibility of increased outdoor dine-in at restaurants. Meanwhile, COVID cases trending down throughout the country, and the ease of restrictions that come along with that seems to already have a positive impact on restaurants.
