


May Highlights Soft Sales Growth in 2024
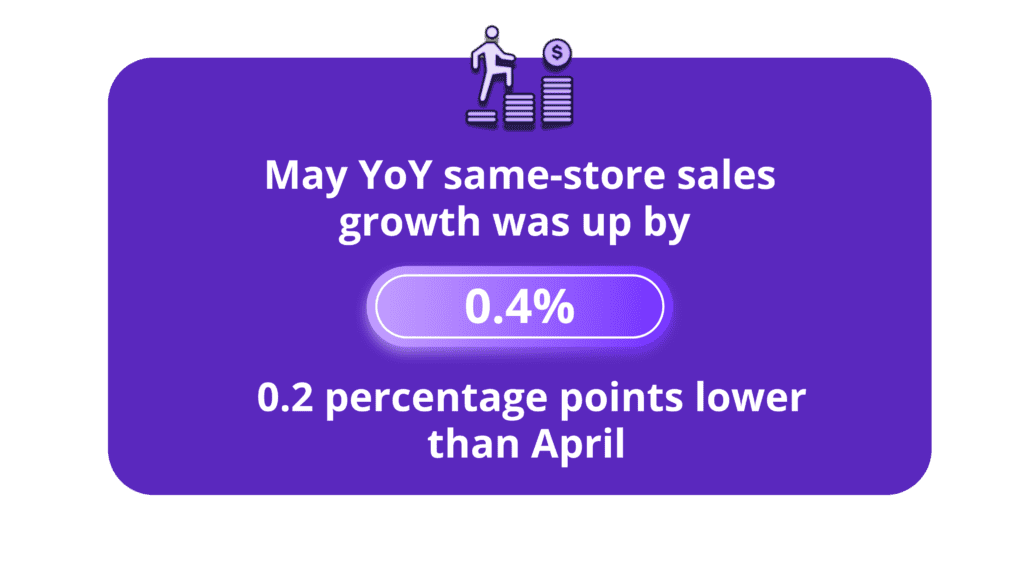
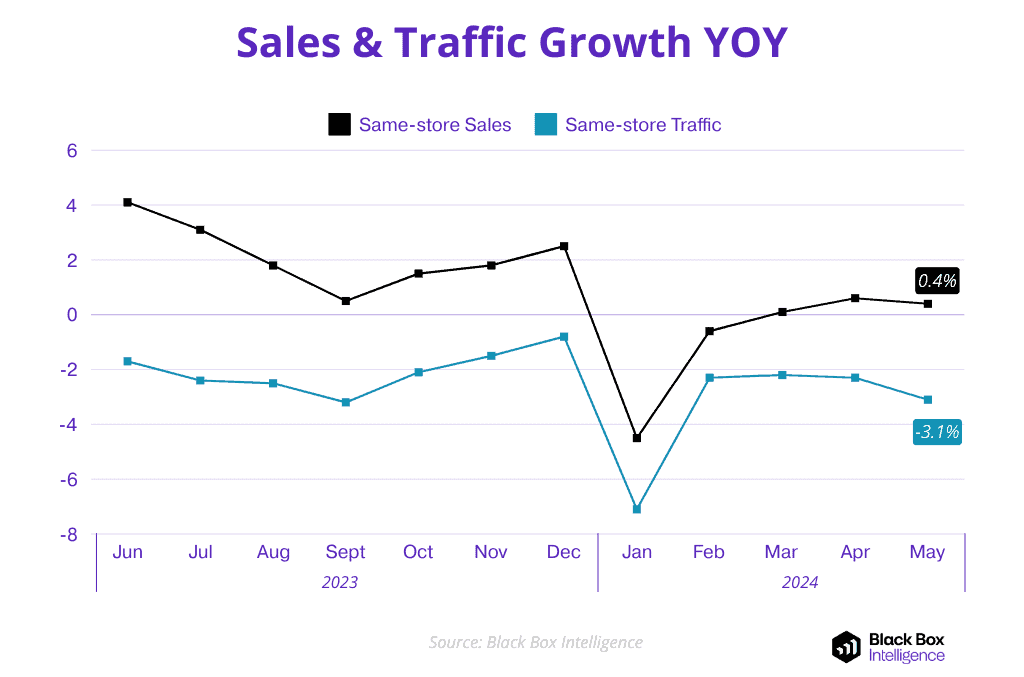
- Same-store sales growth was +0.4% in May, which represented a 0.2 percentage point drop in year-over-year growth relative to April.
- Sales growth has now been less than +0.6% during each month of 2024 so far, highlighting the softness of the industry this year.
Same-Store Traffic Growth Decelerates

-
Same-store traffic growth dropped to -3.1% in May, a deceleration of 0.8 percentage points since April.
-
May was the first month in which restaurant same-store traffic was worse than -3.0% in the last eight months (excluding January, which was badly affected by adverse weather).
Check Growth Accelerated Again

Average check growth accelerated again, reaching +3.8% after averaging +2.7% during the first four months of the year.
Restaurant Segment Breakdown: May 2024
- Segments experiencing acceleration in their check growth: fast casual, family dining, and upscale casual.
- Quick service and casual dining (where several iconic brands have introduced value offerings) saw a slowdown in year-over-year check growth in May.
- The regions with the strongest same-store sales growth: the Southwest, Texas, New England, and the Midwest (all performed better than +1.0% during the month).
- Regions with negative same-store sales growth: New York-New Jersey, California, and Florida.
Restaurants Struggle to Maintain Google Ratings
In the era of the internet, online review sites were akin to word of mouth. In the era of the smartphone, when one opinion can reach thousands, online review sites are akin to a megaphone.
Google is the King of Review Sites
It is hard to overstate how essential Google ratings are for businesses. Google makes up 73% of all online reviews. For comparison, Yelp, TripAdvisor and Facebook together only account for 12% of reviews.
This disparity is even more stark when it comes to the restaurant industry. In Q2 of 2024, Google made up 93% of all reviews captured according to our data (which also monitors Yelp, Trip Advisor and Facebook).
Average Star Rating Correlates to Sales
Google reviews have real world consequences. 95% of consumers read online reviews before buying a product. This again, is reflected in the restaurant industry.
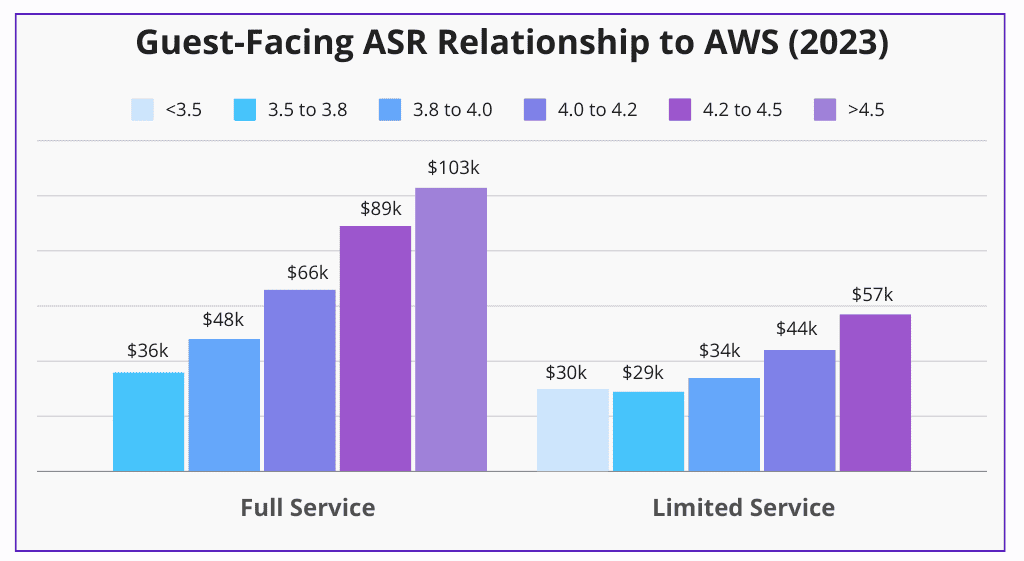
When we map Black Box Intelligence’s Financial Intelligence to Average Star Rating (ASR) on Google, the results speak for themselves. A unit’s Average Weekly Sales (AWS) has a linear relationship to its Guest-Facing ASR – the rating a customer sees when they look up a restaurant on Google.
The Million Dollar Difference
In 2023, a Limited Service restaurant with an ASR between 3.8 and 4.0 averages $34,000 in sales a week. Its peer with a rating between 4.0 and 4.2 averages $44,000 a week. That is a half million dollar difference between those two ASR buckets on an annual basis.
The correlation in Full Service is even stronger. A unit with an ASR between 4.0 and 4.2 has an AWS of $66,000. Its counterpart with an ASR between 4.2 and 4.5 has an AWS of $89,000. Over the course of a year, that’s a difference of $1,196,000.
Most Units Are Underperforming
Unfortunately, most restaurants have struggled to outperform their Google rating since 2022. Whether the reason is high prices, lower quality, or more judgmental consumers, the reviews collected since 2022 have actually been worse than the long-term average that Guests see when checking Google.
In Q2 of 2024, 52% of Full Service restaurants had reviews in that time period that were better than their current average star rating. In other words, more than half of units were improving their Guest-Facing average star rating, but barely. This is a notable improvement from the entirety of 2022, when 60% of Full Service units Guest-Facing Google Ratings received WORSE average ratings than their overall ASR.
Limited Service also experienced progress since 2022 when only 24% of their units were outperforming their long-term average. However, this improvement in the last quarter shows only 39% of their units beating their Google ASR. The bottom line: even with the improvement, Limited Service Google Ratings are weakening.
Improving Your Score In the Long and Short Term
Fortunately, or unfortunately, most units’ Guest-Facing ASRs don’t move easily. A good or bad quarter is unlikely to make a huge dent in these long-term scores, especially for established units.
The good news is shorter term wins can result in better financial performance as well. Based on our own prior research, Full Service restaurants with an improvement in ASR from the previous year had 2% higher traffic than companies with an ASR dip.
Improving your Guest-Facing ASR is not a sprint. It’s moving an ocean liner. It requires patience and sustained commitment. But the financial rewards are major and often evident even before that all-important number on Google changes.