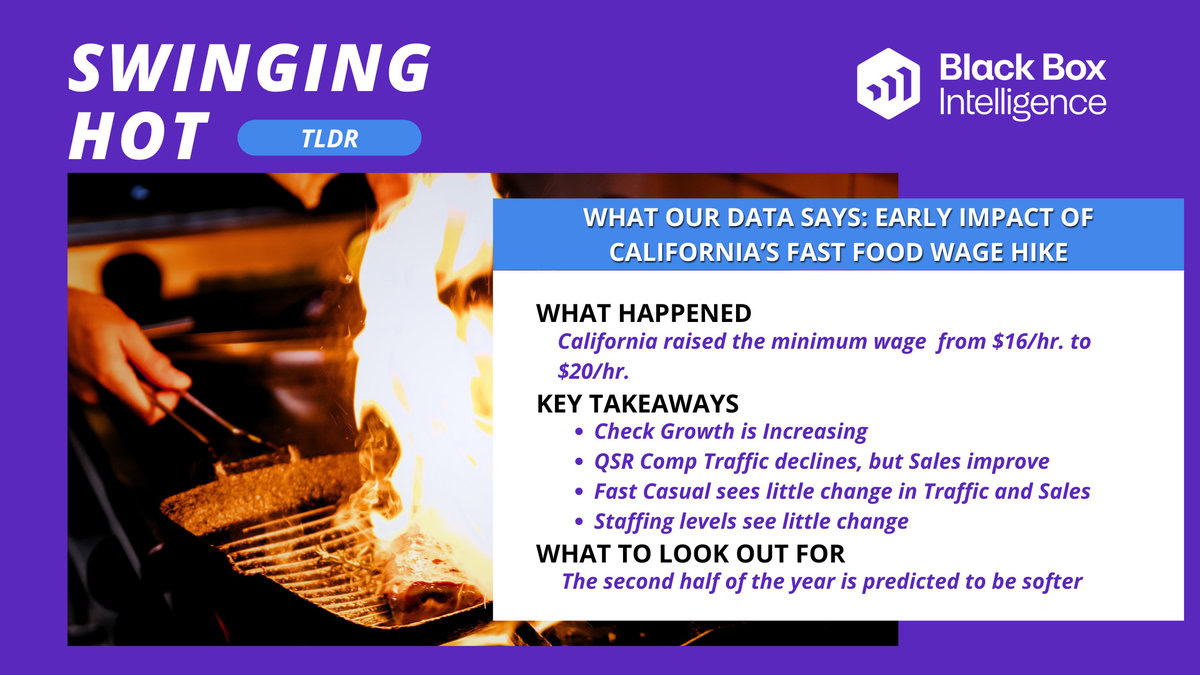
California’s recent minimum wage hike, from $16 to $20 per hour, has caused quite a stir in the industry.
While some brands have closed their doors, others have hiked prices to cope. However, many restaurants have thrived, finding new opportunities in the change. Here’s a quick look at the key developments – according to our data – you need to know about these changes and what to expect in the future.
Key Developments
Rising Dough: Check Growth is Increasing
Historically, we know that check growth is affected by many things. But price increases have the biggest impact.
In California’s case, based on our data, we see that the significant check growth in Quick Service Restaurants (QSR) aligns almost perfectly with the minimum wage change.
QPR’s per transaction average (PTA) growth accelerated by an average 6.8 percentage points more than for the rest of the country compared to the 2nd half of 2023.
What is interesting about this data is how it stacks up to that of Fast Casual’s PTA Growth.
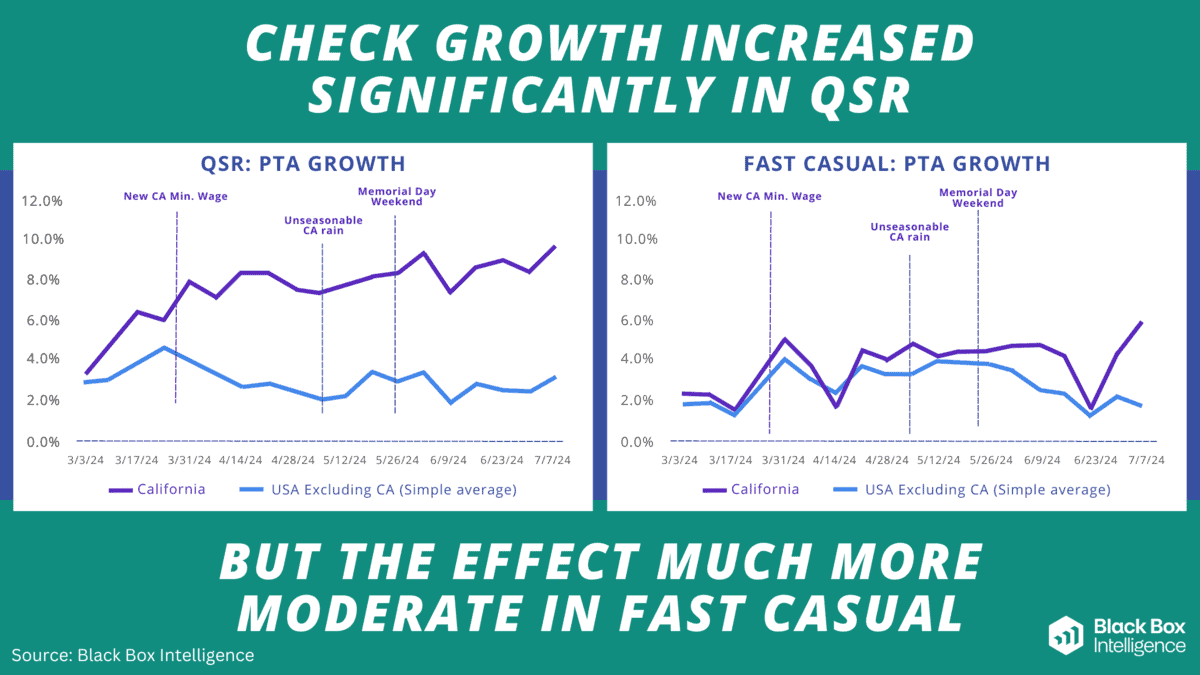
Even when accounting for factors like weather and holidays like Memorial Day Weekend, Fast Casual was not impacted as much as QSR.
Fast Casual saw an average check growth increase of 0.2%.
This is more closely aligned with national trends as opposed to QSR.
Traffic Jam: Navigating Comp Traffic and Sales
Then, if we look at sales and traffic, for QSR in particular, we saw Comp Traffic fall by an average of 3.5% compared to the 2nd half of last year.
Our team was not surprised due to the data we saw around the general decline in the number of overall transactions.
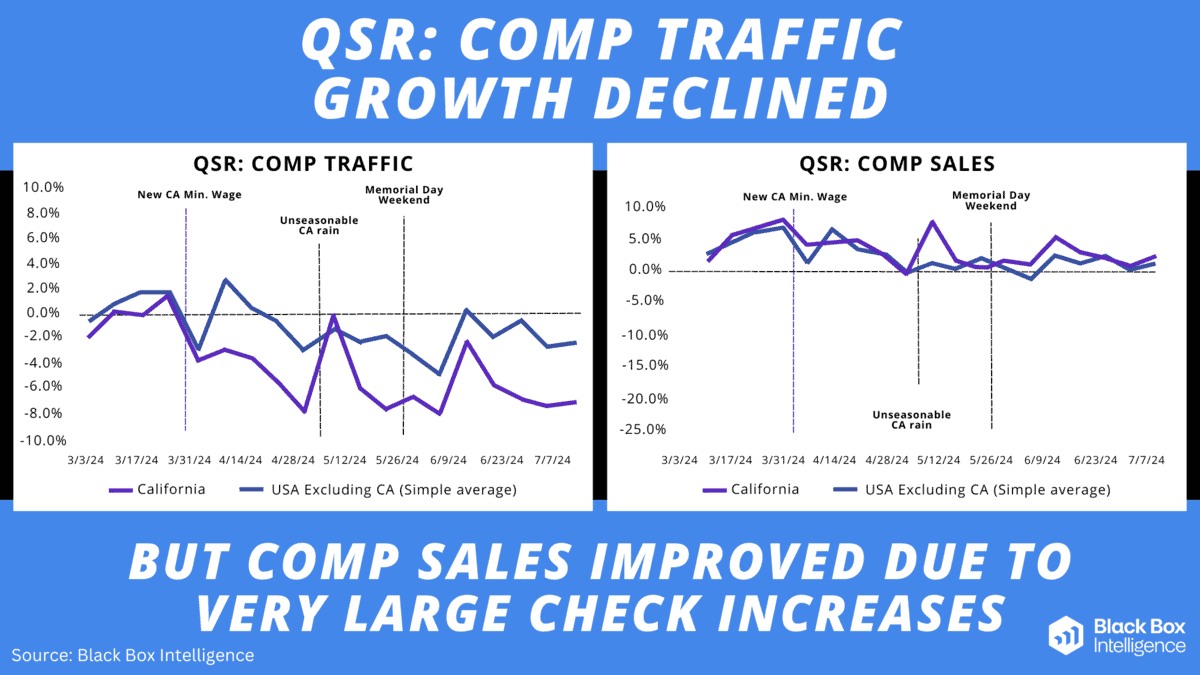
Despite the drop in traffic, we see that the comp sales improved by an average of 2.8%. In other words: prices have gone up, and so have sales.
So that’s a win, right?
Not exactly.
Historically, our data shows that the more you raise prices, the worse your traffic becomes – which ultimately leads to sales losses despite the short-term gains.
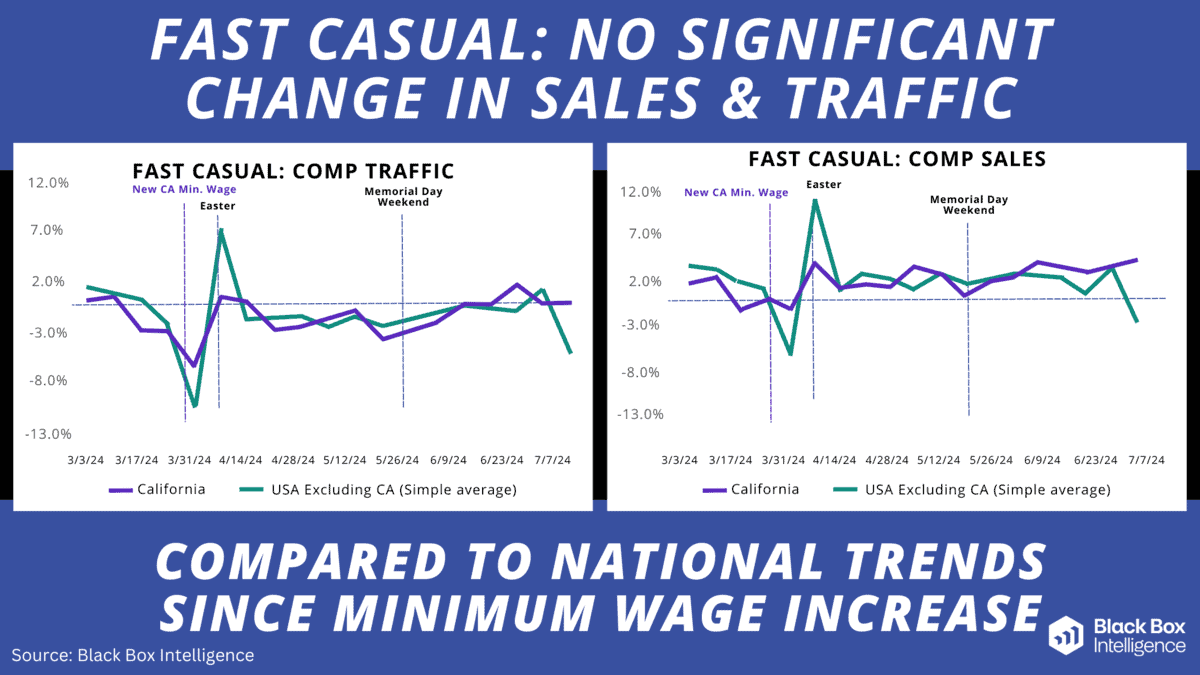
But for Fast Casual, comp traffic increased by an average of 1.9%, and comp sales increased by an average of 2.1%. So there was little to no significant change compared to national trends (with a brief exception for anomalies caused by the Easter break).
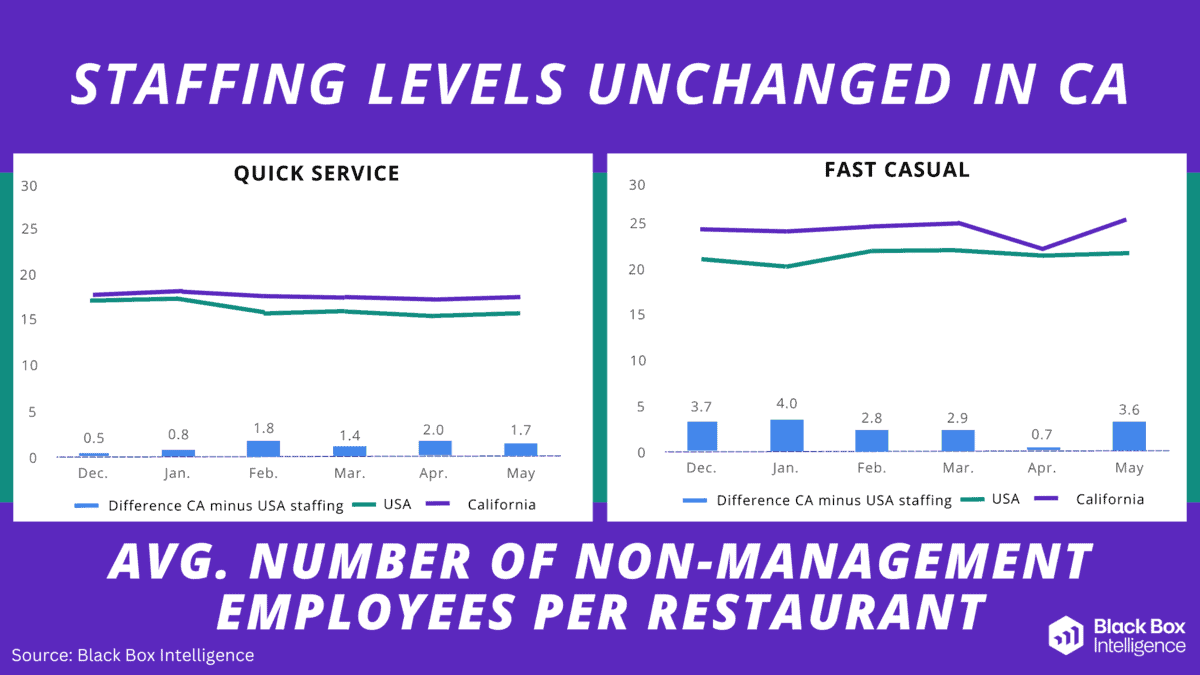
Steady Cook: Staffing Levels Unchanged
Before the California minimum wage change, many were concerned about staffing.
Assuming the wage increase would mean higher prices and fewer sales, the fear was there’d be more turnover.
But, as we talked about, sales are good right now so these concerns have ultimately proved unfounded.
In fact, our net data shows that there are actually still more employees per location in California than in the rest of the country.
Interestingly, the California minimum wage change has not negatively impacted employment trends for both QSR and Fast Casual.
What’s on the Table?: What the Data is Forecasting
So what does it all mean? We have seen a poor start to the year, but now it’s better, right?
Well, at Black Box Intelligence, we are making predictions based on four variables year over year (YOY):
-
Real Disposable Personal Income
-
Real Consumer Spending
-
Food At Home Prices
-
Unemployment Rate
On the one hand, we’re expecting the consumer to have more spending power based on our Real Disposable Personal Income numbers.
But based on consumer behavior, grocery prices, and unemployment numbers, we recommend expecting a soft year for the restaurant industry.
We hate to say it, but the smart money would be on a steeper decline in traffic and a dip in comp sales.
We can help
Because of the California minimum wage increase, many brands have been impacted by low comp traffic. This has led them to bump up their prices.
However, the data shows that this is not a sustainable approach in the long term.
We also have predicted the second year to be more challenging for restaurateurs generally. So, how can you combat impending negative effects?
By being data-driven. Only then can you make informed decisions about how you should react to its impact.
The good news is Black Box Intelligence can help. If you want to dig deeper, consider a meeting with one of our experts.