FEBRUARY: BY THE NUMBERS
Discover the latest insights from February 2024 Restaurant Trends, revealing a concerning decline in sales alongside the critical importance of maintaining cleanliness for positive customer ratings.

Expected Softening in Restaurant Sales May Be Here; Creating an Even Bigger Incentive to Keep Restaurants Clean
February 2024 Restaurant Trends provided a much clearer picture of the current state of the restaurant industry after January’s noisy data painted a much bleaker (albeit inaccurate) picture. Same-store sales growth for restaurants was -0.6% in February. Despite the very robust improvement of 4.0 percentage points in the year-over-year sales growth rate for the industry compared to the previous month, the rebound was not strong enough to lift the industry back into positive growth territory. Furthermore, excluding January of this year, which was negatively impacted by the weather, February 2024 was the worst-performing month based on restaurant sales growth since February 2021. This means that we have reached a low point in the post-Covid recovery when it comes to year-over-year sales growth.
The latest data shows that the expected slowdown in restaurant sales may be upon us. After the holidays, the expectation was for consumers to start pulling back on their restaurant visits and spending, which is what the February data suggests. With credit card balances growing rapidly, interest rates remaining very high, and savings being depleted due to inflation stubbornly holding on to higher levels than the 20-year average before COVID-19, it should not be surprising that consumers are moderating their restaurant consumption.
However, the way this slowdown is happening has been interesting. Same-store traffic growth was -2.3% during February, which represented an extreme 4.8 percentage point acceleration relative to the previous month’s growth rate. Same-store traffic growth, although still negative, is holding up better than what we are seeing with same-store sales. To illustrate this point, same-store traffic growth in February was 0.8 percentage points softer than in November, while same-store sales growth eroded by a much larger 2.4 points. The reason, of course, is that average check growth YOY is moderating rapidly and is now under historical average levels.
Average check grew by only 2.0% year over year in February, a sharp decline from the 3.0% reported for January. To illustrate how much check growth has been moderating, back in February of 2023 annual growth was 7.0%, while two years ago it was 11.1%. Only one industry segment is still experiencing unusually high check growth: family dining. All other segments posted check growth under 3.0% during the month.
Limited Service Segments Achieved Positive Sales Growth
Only the segments classified under limited service achieved positive same-store sales growth in February. Quick service and fast casual were the top performers in the industry based on same-store sales growth for the second consecutive month. Quick service has been the segment with the strongest sales growth since July of 2023.

Guests Notice Cleanliness Issues, and the Result Will Be Lower Ratings for a Restaurant
“Customers don’t like to eat at dirty restaurants” is maybe the most self-evident statement made on this blog. Nevertheless, when you dive deeper into the data, there are insightful findings in even the most obvious of assumptions.
According to Black Box Intelligence data, in 2023 words relating to “cleanliness” were mentioned in 6% of all reviews for full-service restaurants and 9% of limited-service reviews. While this may seem insignificant, considering that food and service are both mentioned in 73% of full-service reviews (69% and 59%, respectively, for limited service), one cleanliness mention for every 10-20 reviews is still substantial.
But what is imperative to realize is that less frequency in reviews does not mean customers find cleanliness unimportant. They just tend to only mention it when something is wrong. For this reason, reviews that include a cleanliness-related term are likely to result in a lower star rating than the average star rating (ASR) of a restaurant. Reviews that contain a cleanliness-related mention have an ASR of 3.2 for full-service restaurants, nearly a full star below the overall rating for 2023. In the case of limited-service restaurants, the ASR of reviews that contain a reference to cleanliness is 3.3, which is almost half a star lower than all reviews for this category.
Cleanliness since COVID
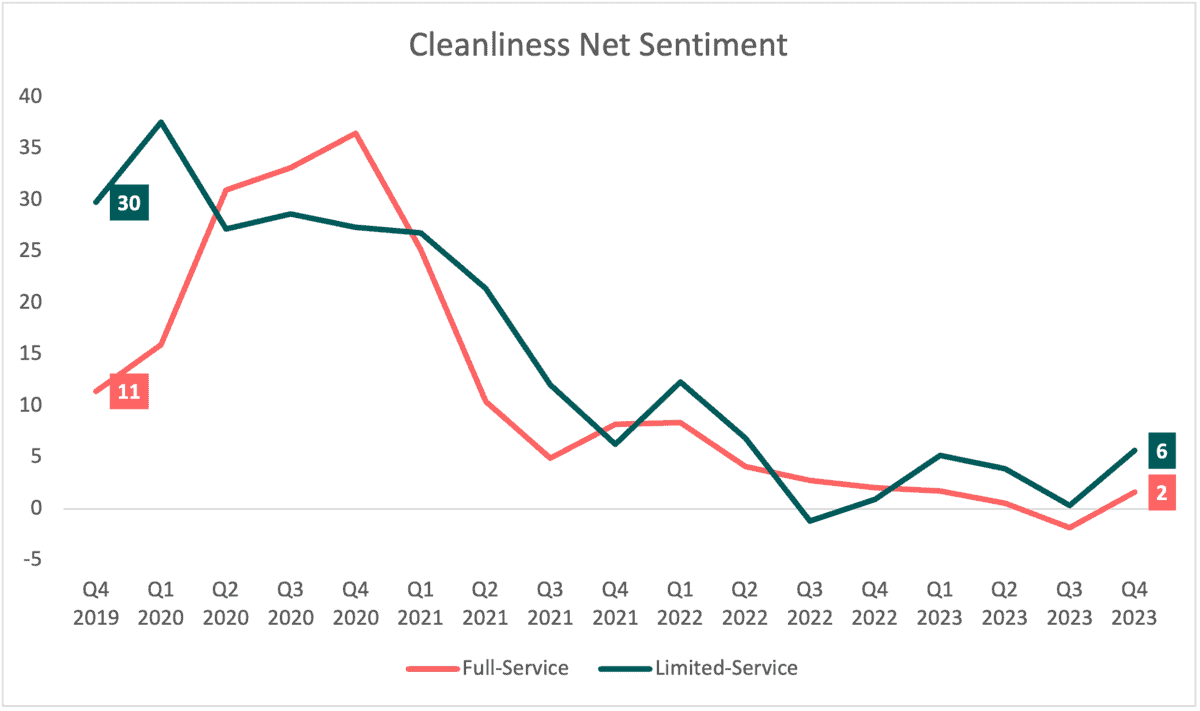
While cleanliness net sentiment (the percentage of positive mentions minus the percentage of negative mentions for this attribute) has always been lower on average than for other attributes, it has seen a substantial dip since the pandemic. Full-service cleanliness net sentiment was at 11% in Q4 of 2019, during COVID it rose to 36% in Q4 of the following year, likely from grateful customers aware of the massive difficulties operating a restaurant under COVID protocols. However, since then it has seen a drastic decline. In Q4 of 2023, full-service cleanliness sentiment was at 2%, 9% below 2019, and a whopping 34% below 2020. Limited service has also crept down since the pandemic. In Q4 of 2019, it had a cleanliness net sentiment of 29%, 4 years later it was down to 6%.
A potential explanation for the drop could be due to customers being more cautious about hygiene due to COVID, however, that is unlikely to explain the continued poor performance in 2023. A more likely explanation is staffing. The staffing shortage over the past several years hit the restaurant industry particularly hard. Limited service restaurants are down on average about 1 hourly employee per unit compared to pre-pandemic and full-service restaurants are down about two. Fewer employees mean it’s harder to maintain cleanliness at the same standards. Whatever the rationale, based on February 2024 Restaurant Trends, customers are less satisfied with the overall sanitation of restaurants.

Digging up the Dirt on the Restaurant Industry
With this multi-year sentiment dip in mind, it can be helpful to utilize our Guest Intelligence review data to locate the areas of the restaurant customers find most unpleasant from a cleanliness standpoint by filtering only mentions of the word “dirty.”
Unsurprisingly, all areas are ranked poorly. However, what is surprising is that “restroom”, the most obvious culprit is neither mentioned the most nor rated the worst. For full-service restaurants, the table, seat, and tableware are the largest detractors to cleanliness, making up 50% of dirty mentions with an ASR of 1.8. Limited-service restaurant customers were less concerned with seats, likely due to the majority of their business being off-premise. However, “table” makes up 31% of all dirty complaints; with a specific area of concern being “counter”, which carries a very low rating of 1.6.
While a spotless bathroom might be ideal, putting an unclean fork in your mouth is unforgivable.
Cleanliness is mentioned less often in reviews than food or service, not because it is less important, but because it’s expected. Even with excellent food and service, a dirty restaurant lacks appeal. Getting the fundamentals right, including properly wiping silverware and tables, will help minimize those critical cleanliness mentions and raise ratings.
