Restaurant Performance: Best vs Rest Analysis
Top Performers Adapt to New Definition of Value
In our “Best vs. The Rest” series, we are decode the DNA of the industry’s top performers. We explore how they manage feedback, how they, defy and stay ahead of the market, retain their GMs and they set team members up for success. Here, we look at the hottest topic right now: the evolution in value perception and how the best brands are adapting to it.
Level-Setting
For years, the restaurant industry operated on a simple assumption: if you improve food and service scores, traffic will follow. For 2026, that correlation has broken.
When we analyze the top 25% of brands—those defying traffic trends—versus the rest of the industry, we see a new reality. The winners aren’t necessarily the brands with the friendliest staff or the highest culinary ratings. They are the brands that have best adapted to the New Definition of Value.
Value is no longer just about “cheapness.” It is a complex calculation of price, execution, and friction. Here is how top performers are rewriting the equation to win share.
Insight 1: Value is the New Center of Gravity
The data is counter-intuitive: You do not need to be perfect to win; you just need to be “worth it.”
In our latest comparison of “The Best” (top traffic performers) vs. “The Rest,” the sentiment gaps reveal a startling shift in priorities.
Top Performers are Winning on Value Sentiment, Even While Trailing Competitors on Service Sentiment
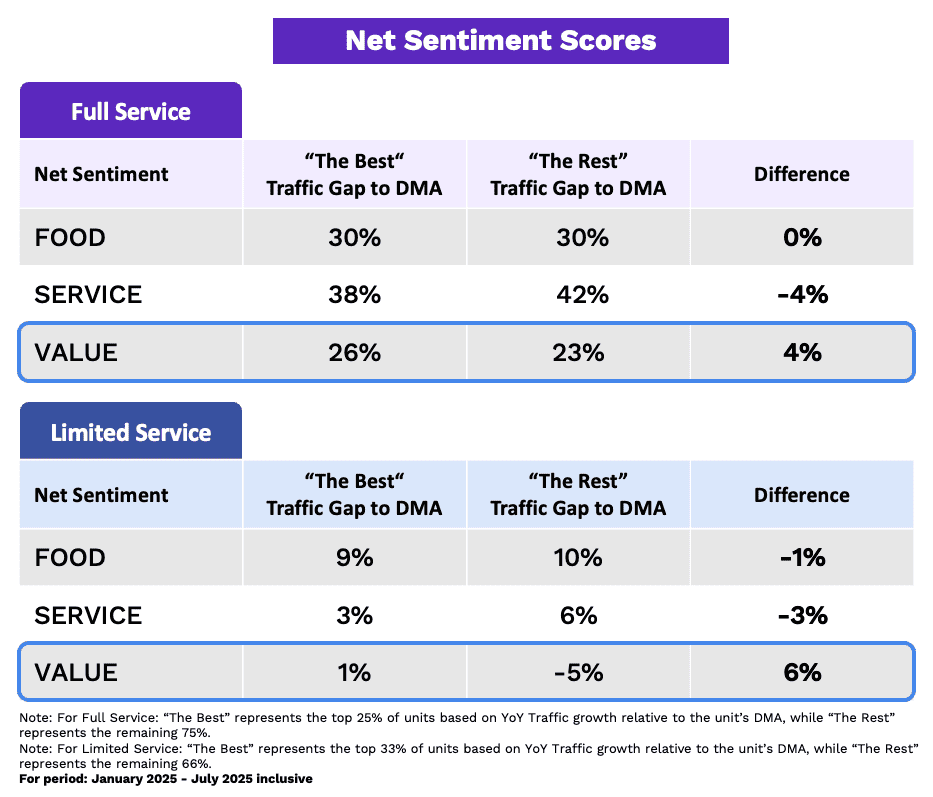
As the table above illustrates:
-
In Full Service: The top performers actually score 4 points lower on Service sentiment than their underperforming peers. However, they score 4 points higher on Value.
-
In Limited Service: The gap is even more pronounced. The top performers hold a 6-point lead on Value sentiment, while “The Rest” have seen their value perception plummet into negative territory.
The Takeaway: The market has shifted. Guests are willing to tolerate minor imperfections in service or food consistency if the value proposition is rock solid. “The Rest” are over-investing in service perfection while missing the price-to-value signal; “The Best” are winning on the deal.
Insight 2: Deconstructing “Worth It” (It’s Not Just Price)
If Value is the deciding factor, how do you engineer it? The data shows that while Price is the anchor, it is not the only variable.
What Makes the Experience “Worth It” for Guests
(Top 10 Positive Aspects Mentioned by Guests)
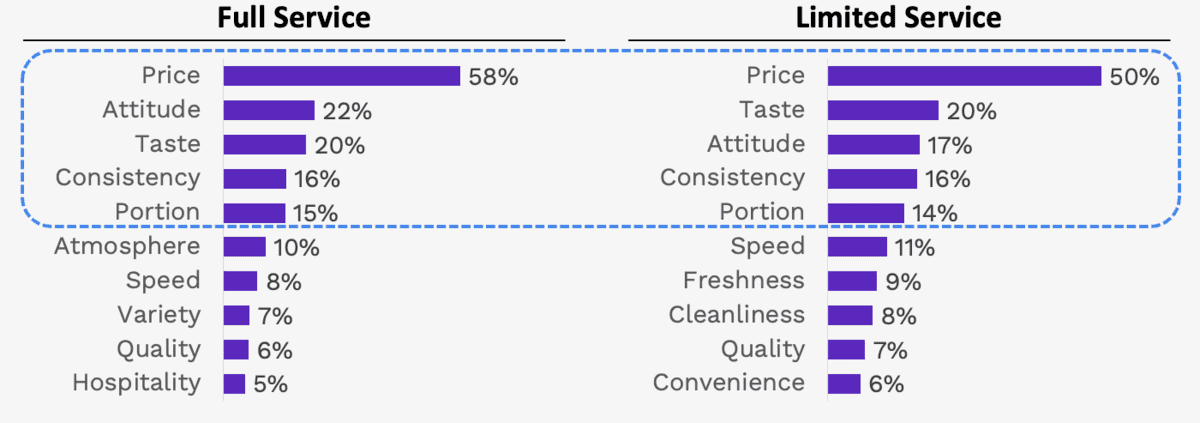
When guests describe an experience as “worth it” now, the components differ by segment:
The Full Service Value Equation:
-
Price (58%) is the dominant driver.
-
Attitude (22%) and Taste (20%) are the critical support pillars.
-
Adaptation: In this segment, hospitality is a value driver. If the staff is rude or indifferent, the price immediately feels “too high.”
The Limited Service Value Equation:
-
Price (50%) is the lead, but less dominant than in Full Service.
-
Taste (20%) ties for second place.
-
Speed (11%) and Consistency (16%) are vital.
-
Adaptation: Here, value is functional. If it isn’t fast and consistent, a low price point doesn’t matter.
Insight 3: The Hidden Meaning of “Price”
It is dangerous to look at the chart above and assume guests just want a lower bill. When we dig deeper into reviews that positively mention “Price,” guests are rarely praising the dollar amount alone. They are praising the fairness of the exchange.
What Do Guests Really Mean by Positive “Price”?
Top Aspects Mentioned Much More Often By Guests
Limited Service
| Theme | Mention Rate Compared to Normal |
| Quality | 4.0x |
| Portion | 3.9x |
| Taste | 1.9x |
| Speed | 1.5x |
Full Service
| Theme | Mention Rate Compared to Normal |
| Quality | 5.8x |
| Portion | 4.3x |
| Taste | 1.8x |
| Speed | 1.8x |
What the data reveals:
-
Quality First: In Full Service, positive price mentions correlate with Quality (5.8x) and Portion (4.3x) far more than Speed or Taste.
-
The “Fairness” Factor: Guests aren’t saying “this was cheap.” They are saying “this was a fair portion and good quality for the money.”
-
The Trap: Brands that cut portion sizes or lower ingredient quality to drop prices are breaking this equation. You cannot engineer value by destroying the two things (Quality and Portion) that define it.
Insight 4: Two Different Strategies to “Win” Value
Adapting to this new definition requires a segment-specific approach. The data shows that top performers are pulling opposite levers to achieve the same result: high Value sentiment.
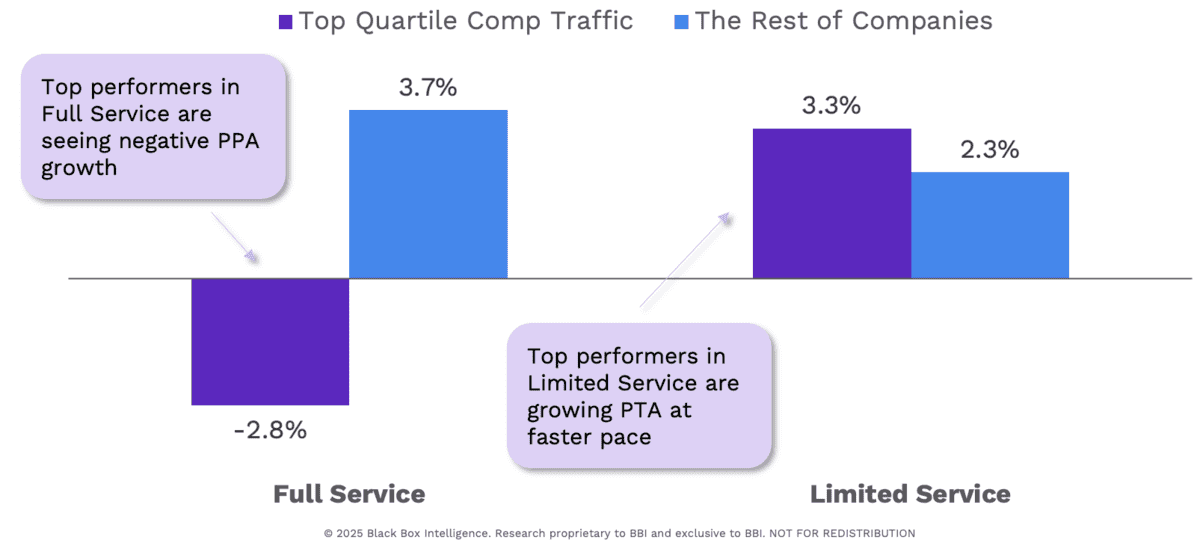
Value Does Not Necessarily Mean Discounting
Per Person or Per Transaction Average Spend Growth YoY
Full Service: The “De-Risking” Strategy
Guests are price-sensitive and afraid of the “check surprise.”
-
The Move: Leaders are lowering Per-Person Averages (PPA) through smart bundling and portion control (e.g., half-plates, lunch pairings).
-
The Result: By controlling the absolute dollar amount (Price) and ensuring hospitality (Attitude), they protect traffic even if it means slightly lower check averages.
Limited Service: The “Additive” Strategy
Guests perceive the base price as fair, so they are willing to spend more for “treats.”
-
The Move: Leaders are growing Per-Transaction Averages (PTA) by selling add-ons, flavor upgrades, and premium customizations.
-
The Result: Because the base “Price” and “Speed” expectations are met, guests reward the brand by building a bigger basket, driving sales growth without pricing guests out.
The Black Box Intelligence Point of View
The brands losing traffic in 2025 are often fighting the wrong war—trying to improve service scores in a vacuum while their value perception erodes.
Here is how to adapt your strategy:
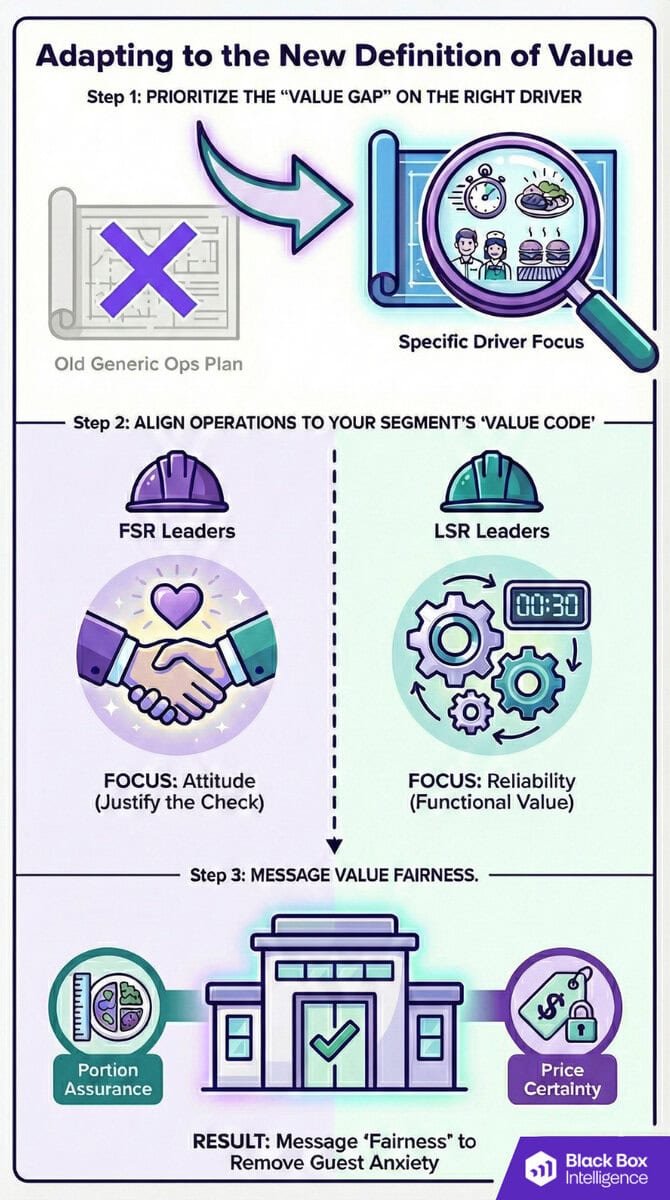
1. Prioritize the “Value Gap” by Fixing the Right Driver: Stop celebrating green scores in Food or Service if your Value sentiment is red. A high operational score in one area cannot mask a “Value Gap” indefinitely. You need to identify why guests don’t feel the experience is “worth it” and attack that specific driver.
-
The Operational Reality: You cannot fix a specific value problem with a generic operational solution. If your value score is suffering because of speed (a key driver in Limited Service), no amount of friendly service will make the guest feel their time was well spent. If the issue is portion size (a key driver in Full Service), faster ticket times won’t make the price feel fair.
-
The Fix: Diagnose the specific component dragging down your “Worth It” rating—is it Portion, Speed, Consistency, or Attitude? Pivot your resources to fix that specific leak rather than relying on general operational excellence to carry the day.
2. Align Operations to Your Segment’s “Value Code”: Once you commit to fixing the specific driver, you must solve for the right variable. The data proves that a guest’s definition of “worth it” changes drastically based on the service model, and your operational focus must match that expectation.
-
FSR Leaders: Double down on Attitude. In Full Service, hospitality is not just “nice to have”—it is a tangible part of the product guests are paying for. Warm, attentive service psychologically justifies a higher check average; indifferent service makes that same check feel expensive.
-
LSR Leaders: Double down on Reliability (Speed & Consistency). In Limited Service, value is functional. Guests are paying for the certainty of a fast, consistent outcome. If the food is slow or the portion varies, the value proposition collapses, no matter how friendly the staff is.
3. Message “Fairness” to De-Risk the Visit Guest anxiety isn’t just about the total price; it’s about the risk of a “bad trade.” Use your menu and marketing to guarantee the exchange. Replace generic “value” claims with specific risk-reducers:
-
Portion Assurance: Don’t leave quantity to the imagination. Use visual menu cues or explicit sizing (e.g., “generous shareable,” “double protein,” “family-sized”) to validate the price point before the plate hits the table.
-
Price Certainty: Combat “check shock” with transparent bundles. Marketing “dinner for two for $40” or “all-inclusive lunch” eliminates the fear of hidden upcharges, service fees, and side-dish inflation.
Note on Methodology: When we refer to “The Best,” we are isolating the top quartile of brands or units based on year-over-year traffic growth relative to their segment and market (DMA) peers. This data doesn’t rely on anecdotes; it is strictly defined by performance metrics within the Black Box Intelligence network.
Learn More About Top Performers
Deep Dive into More Behaviors of Top 25% Restaurant Performers
Return to Best vs Rest main menu or read other articles below.

Restaurant Performance Management
Close The Gap
The Black Box Intelligence Restaurant Performance Network provides the ground-truth data you need to stop guessing and start executing. Build your own path to outperformance.
