Monthly Restaurant Trends Review
Out of the Box: August 2025
-
Restaurant spending and same-store sales growth on an upward trend since March, despite economic uncertainty.
-
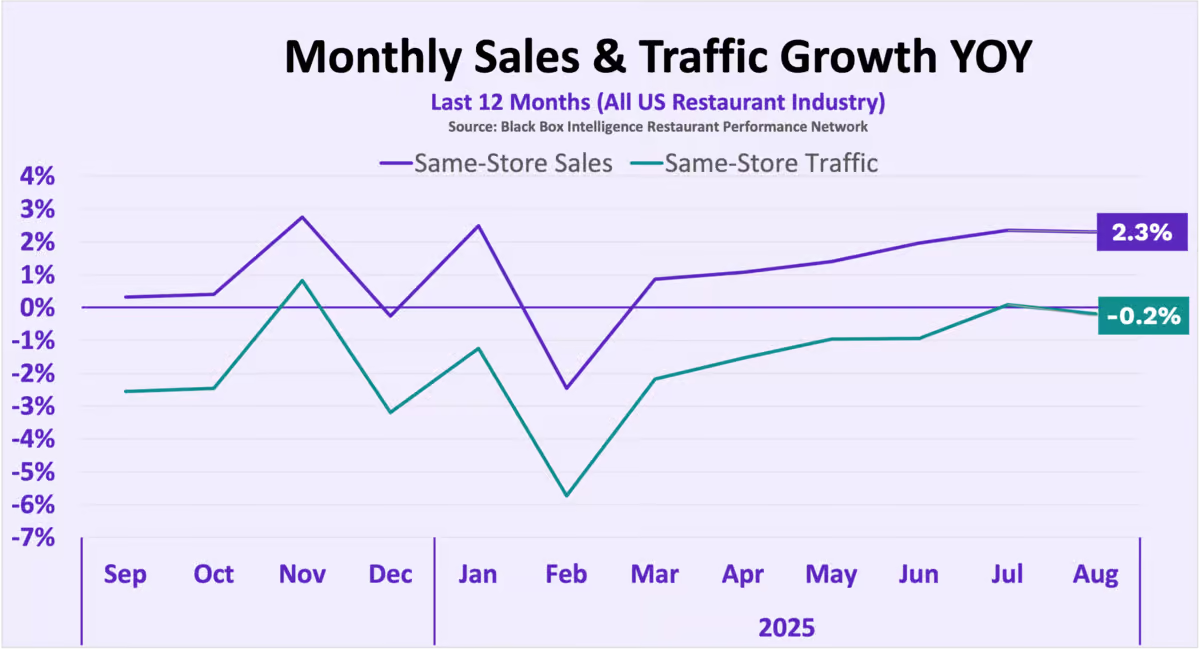
August same-store sales rose 2.3%, one of the strongest results since July 2023, while traffic slipped -0.2% but remained relatively strong by recent standards.
-
Casual Dining has led industry growth in 2025, with two-year sales gains far outpacing all other segments.
-
Beneath the positive headlines, only 47% of all brands tracked by Black Box Intelligence saw sales growth in August, highlighting widening gaps between winners and laggards.
In This Issue:
-
The Big Picture: August Sales and Traffic Trends
-
Segment Focus: QSR
-
Best vs Worst: Region, Segment, and Cuisine
-
Staffing Review: FSR Management Turnover
August 2025 Restaurant Industry Trends
The Big Picture: Sales and Traffic Trends
The economy is slowing, weakening consumer sentiment and darkening projections for the rest of the year. Yet consumers continue to dine at—or order from—chain restaurants at rates exceeding all expectations.
August delivered another month of strong restaurant growth. Same-store sales rose 2.3%, slightly below July’s 2.4% but above June’s 2.0%. Excluding weather and holiday calendar outliers, July and August marked the strongest sales growth since July 2023.
Same-store traffic slipped -0.2% in August, pulling the industry back into negative year-over-year growth. Given trends in recent years, we consider this a relatively positive result. To put it into context: July and August produced the best traffic growth in more than three years when excluding months boosted by weather or holiday shifts.

| Month | Sept. ’24 | Oct. ’24 | Nov. ’24 | Dec. ’24 | Jan. | Feb. | Mar. | Apr. | May | Jun. | July | Aug |
|---|---|---|---|---|---|---|---|---|---|---|---|---|
| Comp. Sales | +0.4% | +0.5% | +2.8% | -0.3% | +2.5% | -2.5% | +0.9% | +1.1% | +1.4% | +2.0% | +2.4% | +2.3% |
| Comp. Traffic | -2.7% | -2.5% | +0.9% | -3.2% | -1.3% | -5.7% | -2.2% | -1.5% | -1.0% | -0.9% | +0.1% | -0.2% |
August 2025 Segment Overview
Best vs Worst: Restaurant Industry Segment

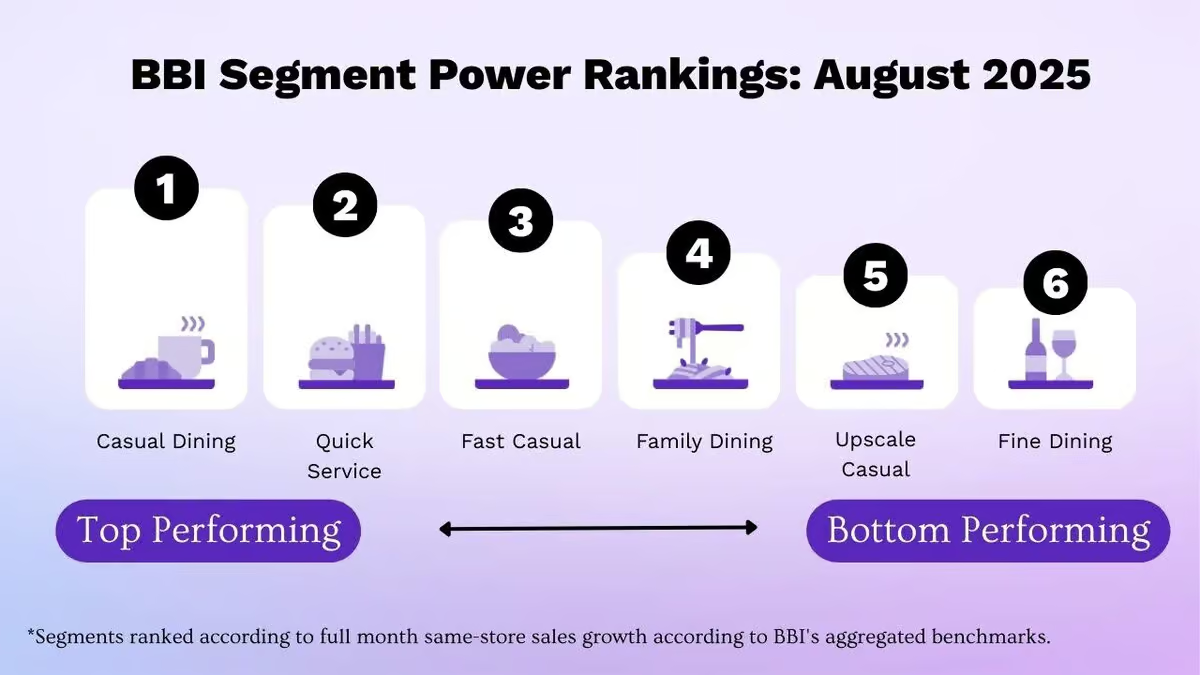
For the second month in a row, all industry segments except those with the highest average guest checks achieved positive same-store sales growth.
The only segments posting year-over-year sales declines in August were Upscale Casual and Fine Dining.
With consumer sentiment at historically low levels and economic uncertainty weighing heavily, spending is likely shifting away from these segments toward more budget-friendly options. Business dining, a bigger driver for Fine Dining than for other segments, has also likely moderated in response to the expected downturn.
At the other end of the spectrum, 2025 has clearly been the year of Casual Dining for sales growth. Some of this strength reflects lapping soft results from the past two years—Casual Dining was the second-worst performer in August 2024 based on same-store sales growth. But since the last quarter of 2024, growth has been outstanding. On a two-year basis, Casual Dining remains by far the industry’s best-performing segment, showing its success goes well beyond easy comparisons.
Large, legacy brands in this space have excelled by delivering what guests want: a good meal, a pleasing experience, and a price that feels worth it.
Yet not every brand is thriving. In August, only 44% of Casual Dining companies tracked by Black Box Intelligence posted positive same-store sales growth.
Region Focus: Y-on-Y Sales
Best vs Worst: Region
The restaurant industry posted strong sales nationwide in August, with all eleven regions we track achieving positive same-store sales growth. Since early 2024, this has only occurred twice before—January 2025 and November 2024. And both these months were lifted by favorable weather comparisons and calendar shifts.
Florida led sales growth in August, but the gain largely reflected a hurricane that hit its coasts in August 2024. Measured against August 2023, Florida ranked in the middle of the pack.
The Midwest, Southwest, and Southeast delivered the strongest 1-year and 2-year sales growth rates. By contrast, California, New England, and the Western region posted the softest results. California has been the weakest region since March, with traffic declines most pronounced in zip codes with large Hispanic populations, especially in Full Service restaurants— we think a key factor behind the state’s ongoing softness.
Restaurant Segment Deep Dive: August 2025
Quick Service (QSR)

QSR on the Rise…
When economic conditions tighten and inflation accelerates, guests typically shift spending to lower-priced options. That trade down may be fueling Quick Service’s improving performance in recent months, as labor market weakness and broader economic concerns shape guest perceptions and behavior.
Quick Service has ranked as the second-best segment for same-store traffic growth over the last two months, trailing only Casual Dining, which is experiencing its own unique revival this year. Just a few months earlier, in April, Quick Service ranked fourth among all segments, but it has steadily climbed in traffic growth ranking each month since.
From June through August, Quick Service’s same-store traffic averaged -0.8%, tied with Fast Casual for second place and only behind Casual Dining.
Staffing, Workforce, And Employment Focus
Current Turnover Trends in Full Service Restaurants

Restaurants continue to see relief on turnover, lowering operator costs and improving guest execution. With the labor market projected to soften in the second half of the year, managers are expected to stay put as employment opportunities narrow, further moderating turnover rates.
Reduced turnover is especially valuable given the high cost of replacing managers. According to Black Box Intelligence’s 2025 Total Rewards Survey, companies spend about $9,500 in training costs for each general manager replaced and around $6,300 for other managers.
The greater impact of general manager retention lies in its effect on hourly employees. Stronger retention at the hourly level drives better execution, guest sentiment, and performance. Full service restaurants that kept their general manager for the past twelve months saw same-store sales growth 3.5 percentage points higher—and same-store traffic growth 3.3 percentage points higher—than those that lost a manager in the same period.
Restaurant Workforce Trends
Get the Full Breakdown of the State of the Restaurant Workforce in 2025
Victor Fernandez, Chief Insights Officer, On:
August 2025 Restaurant Performance
“The industry continues to post optimistic headline results, but beneath the surface it remains a story of haves and have-nots, with many companies struggling despite apparent overall strength.
“Consumers remain resilient despite economic uncertainty and softening conditions. They may be shifting spend between brands or trading down to recent value offerings, but they are still spending more than a year ago. Same-store sales growth, which began trending upward in March, continues to climb. Through both dollars and foot traffic, consumers signal that restaurants remain an important part of their spending.
“Still, the outlook carries reasons for caution. Macroeconomic conditions are showing cracks, forecasts continue to point to a slowdown, and some economists are once again using the word “recession.”
“At the brand level, the reality is even tougher. Despite strong industrywide sales growth, only 47% of brands tracked by Black Box Intelligence posted positive same-store sales growth in August. Those with declining sales averaged nearly -5% year-over-year, while the bottom quartile averaged almost -9%.
“For many struggling brands, the pain is very real, and with conditions set to worsen, more restaurant closures and bankruptcies may lie ahead.”

State of Restaurant Industry
Quarterly Webinar Deepdives
We go into way more detail in our flagship quarterly State of the Industry (SOTI) webinar – our definitive take on the latest developments and a must attend for anyone in the restaurant industry.


