Strategic Expansion in a Saturated Market
Balancing Growth and Risk in the Restaurant Industry
Restaurant development is a boom-and-bust pursuit. The good times bring more units, real estate directors, construction teams, lawyers negotiating deals, etc. When things slow down, as they inevitably do, pipelines empty, and organizations downsize to fit the new reality. Except maybe for the lawyers who must unwind things they originally put together.
The restaurant industry today continues to add units at a pace greater than population growth. One would think this situation can’t be sustained indefinitely. Nonetheless, we’re in a period when a robust economy and easy access to capital make new unit development an attractive option for many companies.
Knowing that we’re either in or approaching a saturated market makes expansion riskier. A correction is almost certainly on the horizon, so successful brands will grow carefully, using the most relevant tools to position their locations for good and bad times.
Mastering Restaurant Site Selection: Blending Data and Experience for Success
Build For Success, Minimize the Misses
Restaurants are expensive to build and mistakes can’t easily be undone. Large systems, units, or markets that don’t meet expectations lead to unpleasant internal scrutiny. For small operators, mistakes can be catastrophic.
The pressure to “get it right” in market screening and site selection has never been greater. Development professionals sift through many options in search of the right combination for a specific brand or application. The goal is a process that maximizes home runs while minimizing the odds of striking out. And the key isn’t necessarily more data – it’s more of the right data.
The Critical Missing Element: Competition
In working with 250+ restaurant brands at Black Box Intelligence (formerly TDn2K), we receive feedback that there is always a need to better understand the competitive landscape when evaluating new markets and sites. To this end, we have created a family of resources that provide objective answers to the inevitable question “How are other restaurants doing?” These generally cover a couple of broad topics: 1) what are the sales characteristics of other operators? and 2) what operating cost factors need to be considered?
The question about existing unit performance has two parts. One is the strength of a market based on comparable sales. Are sales going up or sliding? What are trends in traffic and check growth? How have they been tracked over time? These and other metrics can be measured with precision using data from weekly Financial Intelligence (formerly Black Box Intelligence) (BBI) reports. BBI has long been the industry standard for understanding comparable performance by segment and market.
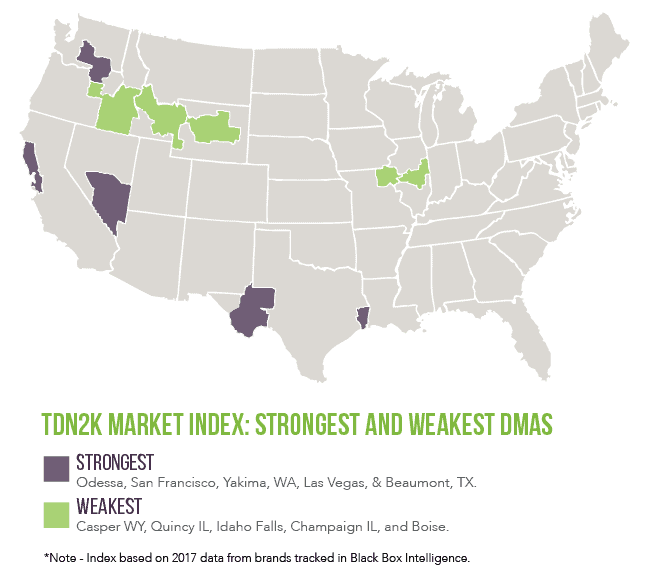
The second performance question is about average unit volumes (AUVs). It’s great to know a market is trending up in comp sales. But it’s even more valuable to get insight into whether other brands have high or low average unit volumes. Knowing how competitors do in aggregate relative to their national averages is a huge advantage in market screening. Using the power of 30,000+ individual restaurants, Black Box Intelligence has created a Market Index resource that describes the AUV performance of 190+ DMAs and roughly 625 3-digit zip areas.
So if you’re evaluating Texas markets, for example, consider that Odessa, Beaumont, and Corpus Christi all index above 1.10 (with 1.0 being the national average). Austin indexes at .92. In Florida, you’d want to consider that Miami has an AUV index of 1.08 while chains in West Palm index at .93. And if the Midwest is on your radar, know ahead of time that no DMA in Illinois has an industry index above .92.

Concerning forecasting operating costs, most big expenses will be within known ranges: food and beverage costs, occupancy, marketing, utilities, etc. But while minimum wage rates make it straightforward to model hourly labor costs, prevailing salaries for management are a big unknown. Workforce Intelligence (formerly People Report)’s index of management salaries is available on a zip code level and fills that need for data on market wages for restaurant management positions. Coupled with BBI and the DMA Index, it’s now possible to get an objective view of sales and expenses that greatly increase the odds of successful development.
Market screening and site selection require a unique blend of art and science. The science part has evolved a lot over time and Black Box Intelligence tools are an important addition to standard resources like demographics, customer segments, and traffic counts. The “art” component is a little like conducting the symphony – pulling all the pieces together to find the right mix for a brand or application. Best-in-class companies combine the right mix of data (science) with seasoned operating experience to build a customized development program.
We’re in a period with a lot of uncertainty and noise. It’s never been more important to take advantage of new tools that reduce risk and increase the odds of success. Objective restaurant benchmarks and indices are a huge step forward in better understanding market dynamics. When balancing art and science, it’s impossible to have too much science.
