State of Restaurant Workforce
Base Pay
We explore all the latest base pay trends in the restaurant industry – from GMs and other management roles to hourly staff.
Summary
After several volatile years, wage inflation has cooled and normalized. That stability lets operators move from reactive pay moves to planned, role-specific merit—and to use cadence (how often you adjust) as a retention tool. The remaining watch-out is mix: where total comp lags inflation—especially for Limited-Service GMs—brands will need to balance base, bonus, and hours quality to defend tenure.
Base Pay Inflation: The Big Picture
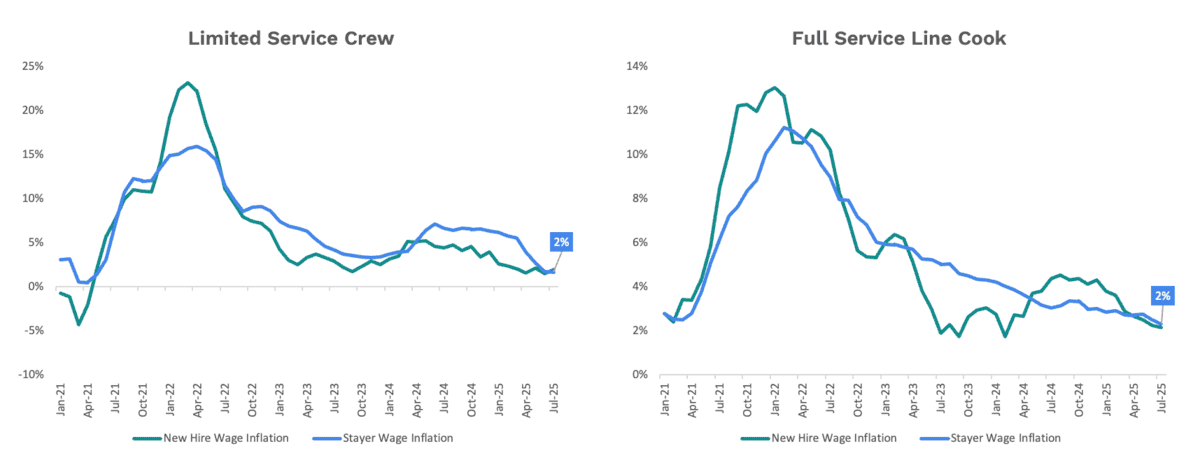
Return to normal: restaurants’ new-hire & “stayer” wage inflation more normal & less volatile.
Note: 3-month average inflation for smoothing
What the Data Says
-
New-hire and stayer wage inflation have converged and cooled, eliminating the big gap that make the labor market more competitive.
-
The current pace is near ~2% on a three-month average, well below the peaks seen in 2021–2022.
-
Lower volatility makes budgeting and mid-year adjustments predictable, reducing the need for off-cycle “catch-up” raises.
-
Operators can redirect dollars from reactive market moves to targeted retention for high-impact roles.
-
Recommendation: Set a fixed comp cadence (e.g., quarterly micro-merit for critical roles) and reserve a small rainy day contingency fund to correct uncompetitive base pay levels where needed.
Base Pay Increases Outpacing Inflation
Our data shows that average base pay trends for General Managers in both full and limited service are outpacing inflation.
Full Service Restaurants
| National Median | YoY Growth | |
|---|---|---|
| GM Base Salary | $77,596 | +2.8% |
| GM Total Comp | $103,454 | +3.6% |
Limited Service Restaurants
| National Median | YOY Growth | |
|---|---|---|
| GM Base Salary | $68,003 | +3.7% |
| GM Total Comp | $72,988 | +0.8% |
*Includes rolling 12-months ending July 2025 vs rolling 12-months ending July 2024
© 2025 Black Box Intelligence. Research proprietary to BBI and exclusive to BBI. NOT FOR REDISTRIBUTION
What the Data Says
- Inflation between Jul ’24 and Jul ’25 was 2.7%.
- Full-Service GMs: Base $77,596 (+2.8%); total comp $103,454 (+3.6%) → real gains versus inflation.
- Limited-Service GMs: Base $68,003 (+3.7%); total comp $72,988 (+0.8%) → real pressure on total earnings despite nominal base growth.
- Divergence raises the risk of manager migration from LSR to FSR (or out of category) unless LSR improves mix.
- Recommendation: In LSR, defend tenure with appropriate and frequent micro-increases, and bonus criteria tied to controllable actions; in FSR, sustain gains while monitoring compression against assistant-manager pay.
State of the Workforce Webinar
Where This Data Came From
Everything cited here was originally shared in our annual deep dive webinar into the state of the restaurant workforce, which was taken from our Total Rewards Survey and our Restaurant Performance Network – meaning all insight comes straight from the HR teams and payroll platforms of the biggest restaurant brands in the country.
