Financial Intelligence for Restaurants
Restaurant Sales Benchmarks That Answer the Hardest Question: Is It You or the Market?
When numbers shift, one question matters most: Is it you – or the market? Black Box Financial Intelligence gives you the answer.
Get access to the industry’s most trusted restaurant sales benchmarks from the Restaurant Performance Network – deep, proprietary sales and traffic performance metrics that come straight from restaurant brands every week.
Restaurant Sales and Traffic Benchmarks
Why the C-Suite and Finance Teams Trust Black Box Intelligence
Whether you’re managing 30 or 3,000 locations, Financial Intelligence gives you the data clarity and market visibility to lead with confidence. Restaurant sales and traffic benchmarks designed to propel you to your maximum potential.
Gold Standard Restaurant Benchmarks
Definitive Traffic and Sales Insight for Restaurants
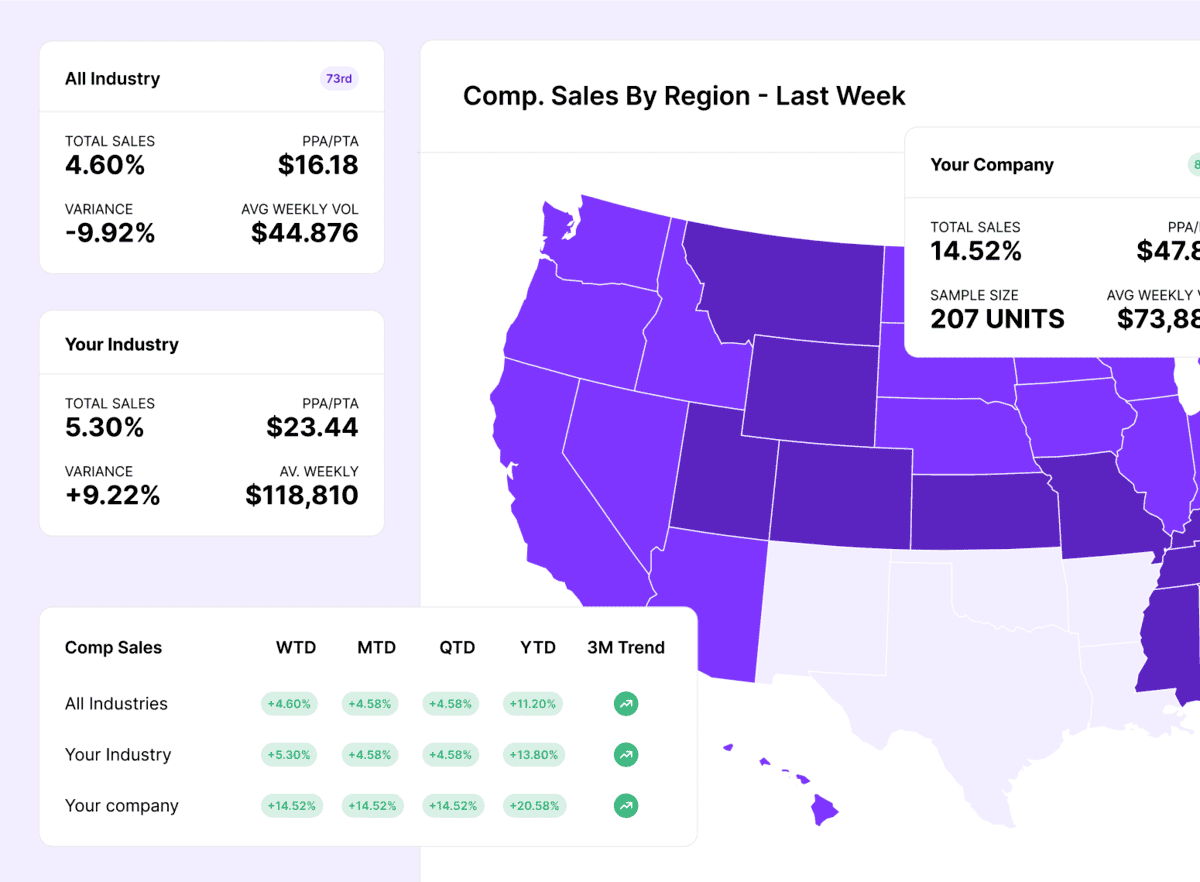
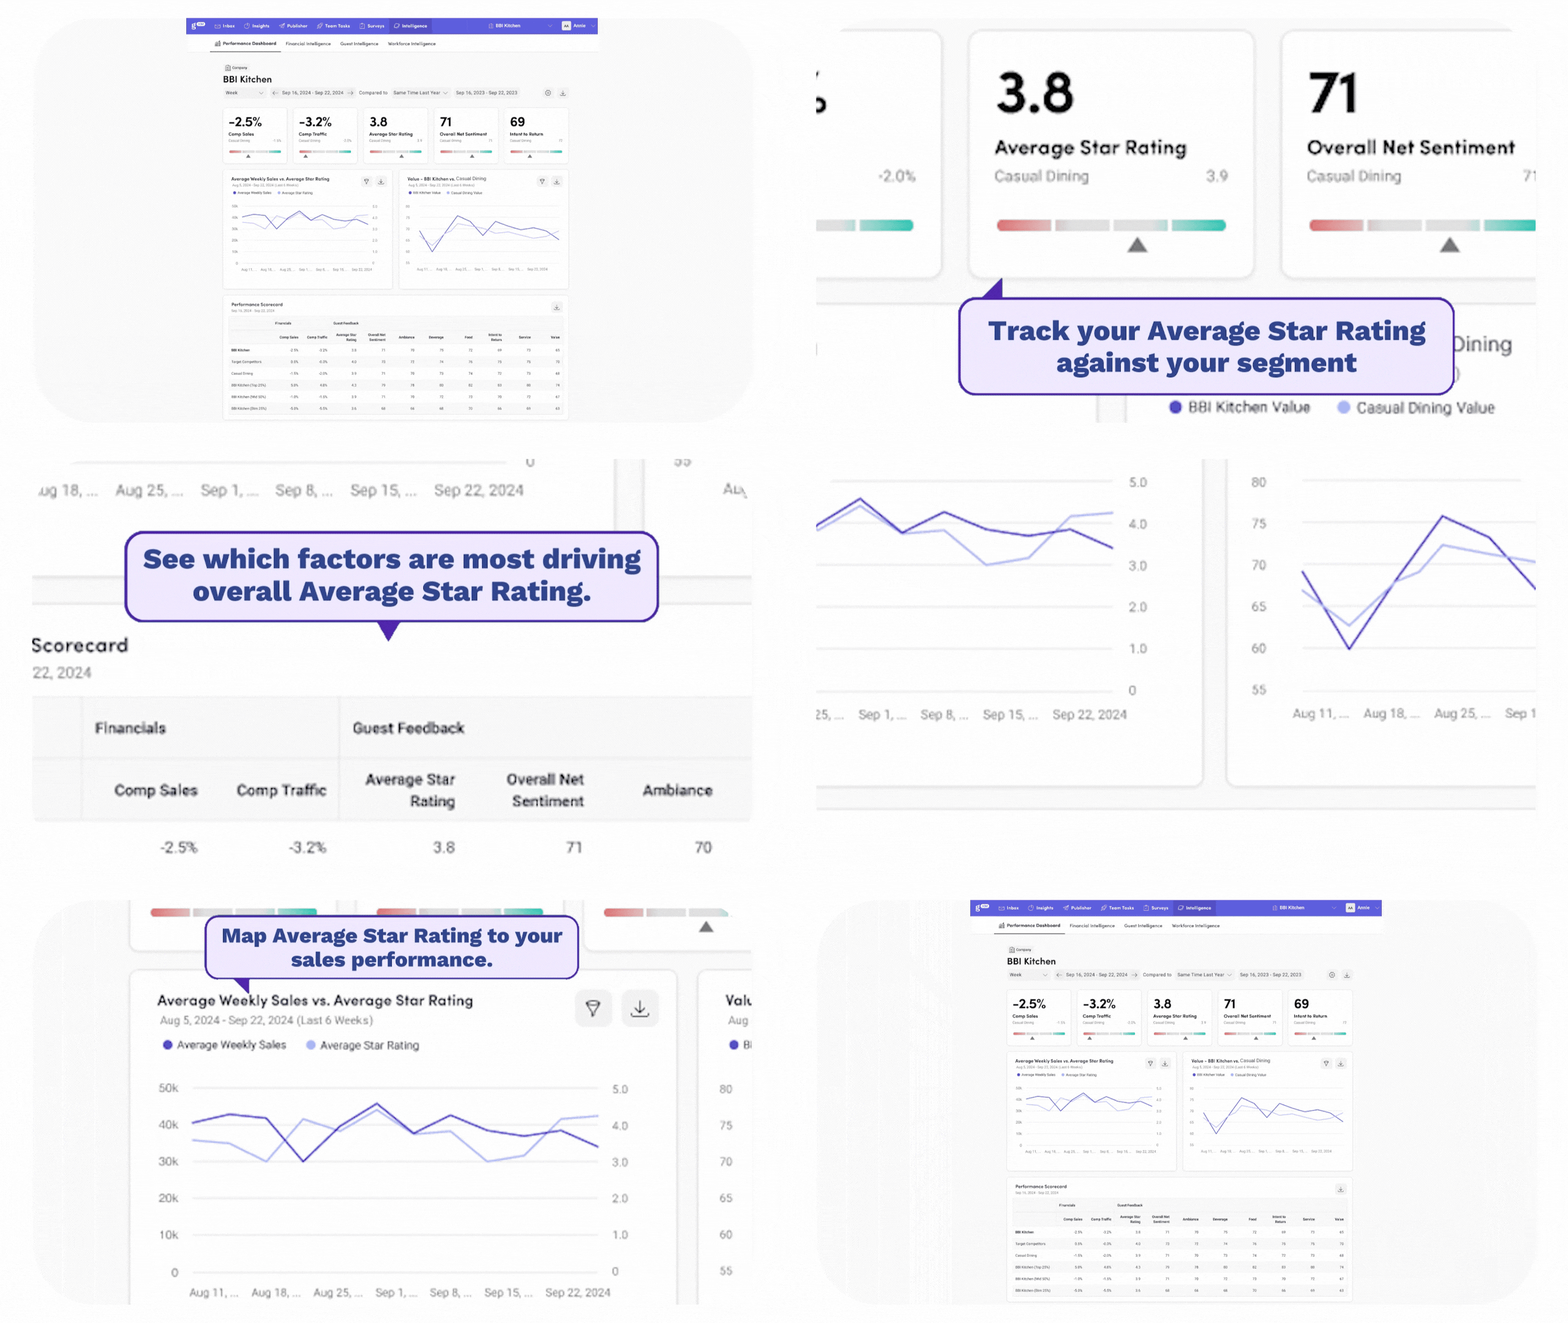
Understand sales and traffic performance with interactive and customizable dashboards that enable you to uncover exactly what’s impacting your numbers over time.

Our traffic and sales benchmarks are updated weekly, which makes them the most-up-to-date financial market comps available.
…and Much More
Gold Standard Restaurant Sales and Traffic Benchmarks
Powered by the Restaurant Performance Network
Our insights come from the Restaurant Performance Network – the largest and most reliable source of financial, workforce, and guest data in the industry.
Maximize your potential with the complete one-of-a-kind performance roadmap that provides all the answers.
Never again wonder: “Is it the market or…ME?”.

Unmatched Restaurant Sales and Traffic Benchmarks
The Meaningful Sales and Traffic Comps Needed to Make Confident Decisions
-
Updated weekly, making them the most up-to-date source of traffic and sales benchmarks available.
-
See your data against other restaurants by industry, segment, cuisine, or however you define “competition”.
-
Drill down into geographies, regions, Nielsen DMAs and units
-
Weekly, monthly, quarterly, and annual comparisons
Talk to Us
Find Out if it’s You or the Market
Performance Intelligence
Fueling the AI Restaurant Command Center With Key Insights
The restaurant sales and traffic benchmarks provided by Financial Intelligence combines with the rest of our platform to fuel our AI Restaurant Command Center – Performance Intelligence.
-
Gain clarity on impact of turnover and compensation on financial performance.
-
Precisely size impact of guest experience and marketing promotions on sales and traffic.
-
Know what’s working, what’s failing, and exactly what to do next.

Talk to us today!
Leave your contact details to learn more about our restaurant sales and traffic benchmarks and we’ll be in touch.


