Restaurant Performance: Best vs Rest Analysis
Why The Winners Focus on “The Negative”
In our “Best vs. The Rest” series, we decode the DNA of the industry’s top performers. We explore how they defy market norms, adapt to trends, retain their GMs and set team members up for success. Here, we turn to one of – if not – the most direct signal of brand health: Guest Feedback.
Level-Setting: The Devaluation of the Five-Star Review
For years, the industry playbook was simple: maximize five-star reviews. Operators chased high “positive sentiment” scores as the primary indicator of guest satisfaction.
However, our most recent data reveals a harsh new reality: Positive reviews have been de-valued.
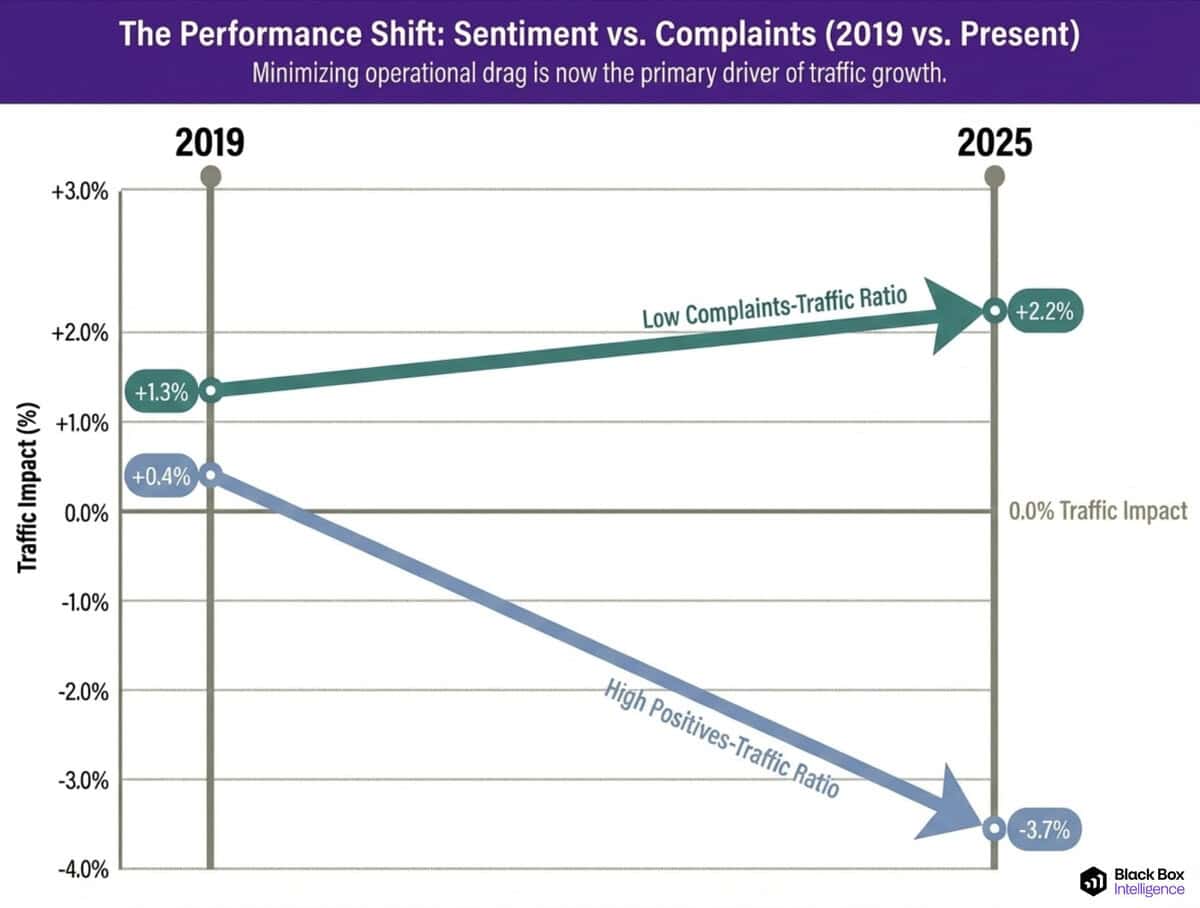
Analyzing millions of restaurant reviews, we found that units with the best positive sentiment-to-traffic ratios enjoyed a +0.4% traffic advantage in 2019. Today, brands with the best positive-traffic ratio with a -3.7% traffic gap.
The market has shifted. Simply accumulating praise is no longer enough to drive traffic. The differentiator for the top 25% of brands—”The Best”—is not how well they fish for compliments, but how ruthlessly they mine and then eliminate complaints.
The New KPI: The Complaint-Traffic Ratio
While “The Rest” focus on average star rating, “The Best” have pivoted to a harder metric (either knowingly or otherwise): the Complaint-Traffic Ratio (complaints per 1,000 transactions).
This metric normalizes feedback against volume, turning a noisy stream of reviews into a clean operational benchmark. And the data shows it is the strongest predictor of growth.
-
The Best: The top 25% of units with the lowest complaint-traffic ratios are seeing a +2.2% traffic lift compared to the segment average.
-
The Rest: Brands that fail to minimize this ratio—even if they have decent star ratings—are seeing their traffic advantage erode.
This is a significant reversal from pre-pandemic norms. The gap between winners and losers is no longer about who has the happiest fans—it’s about who has the least operational drag.
Digging Deeper: The Devil is in the Detail
So to clarify, what we see in our data: reducing complaints-to-traffic ratio now tracks more closely with traffic performance than simply generating more compliments.
To be clear: While increasing guest facing ASR is important and tied to average weekly sales. But, as more and more brands solicit reviews, reducing negative insights has become more important than increasing positives for traffic growth.
So: compliments still matter, but complaint density is the lever more likely to move the business nowadays.
Full-Service Traffic Growth; Sentiment Normalized for Traffic Volumes
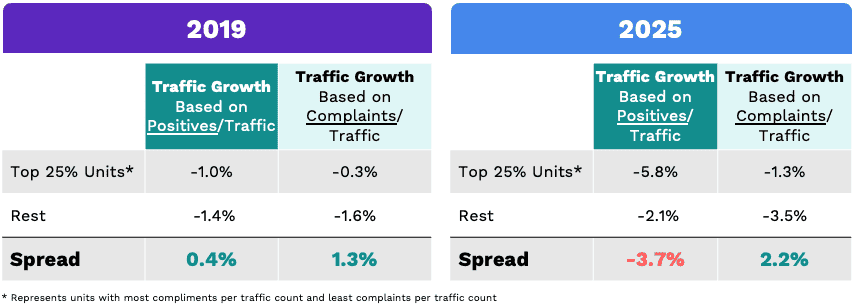
Based on these numbers, general increases in review volume in recent years has de-valued positive reviews. The units with the best 25% (i.e. highest) positive sentiment-to-traffic ratio experienced +0.4% difference in traffic in 2019. Nowadays, that difference is -3.7% – meaning a delta of -4.1%.
Conversely the 25% of units with the best (i.e. lowest) complaints-traffic ratio experienced +1.3% in traffic in 2019, Now, that difference is +2.2% – a delta of +0.9%.
The Opportunity is in the Text
To lower your Complaint-Traffic Ratio, you need data. Fortunately, your guests are already giving it to you.
Many operators assume reviews are just “ratings” with little context. The data proves otherwise.
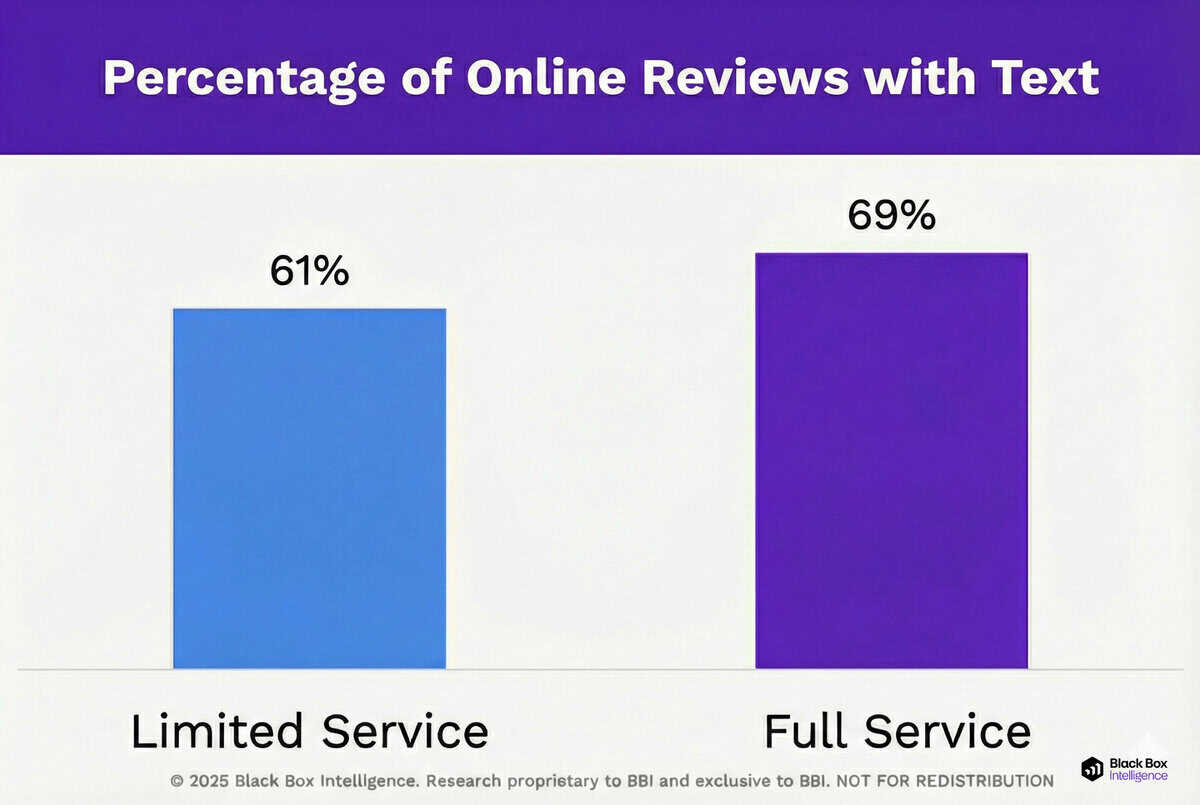
Bottom line: up to 2/3 of reviews include actionable feedback – which means there’s plenty of content to mine through and establish where exactly the biggest opportunities lie for your brand.
There are plenty of reviews that are “rating only” and don’t include any accompanying explanation.
But the data shows that most guests do take the time to provide written feedback to tell you more about their experience.
And the beauty is that this is mostly unprompted feedback. You are not asking the questions, you are just listening to what they have to say.
This means it is feedback in their own words on their own terms, allowing you to get to the heart of the main issues facing your business.
Surfacing the Actionable Nuggets in ALL Your Reviews
So, you’d think the first place to start for finding useful negative insights would be your 1 and 2 star reviews. And you wouldn’t be wrong. You will likely find plenty of impactful things to fix within these.
But you certainly shouldn’t ignore your positive reviews either. With the right analytics engine, you can surface the key negative themes in your 4 and 5 star reviews.
Think about the context here: these people are generally very happy with their experience. But there are little things that would have made it perfect. And like we see above, striving for perfection is just what top performing brands do.
Even the happiest guests leave clues. Within positive reviews that still include a negative, the most common pain points are accuracy, food execution, price, speed, cleanliness, and staff attitude. These micro-frictions quietly erode loyalty and are easy to miss because the star rating looks fine at a glance. Surfacing—and fixing—them is the operational unlock that separates the best from the rest.
Here’s what negative themes we see in positive reviews industry wide.
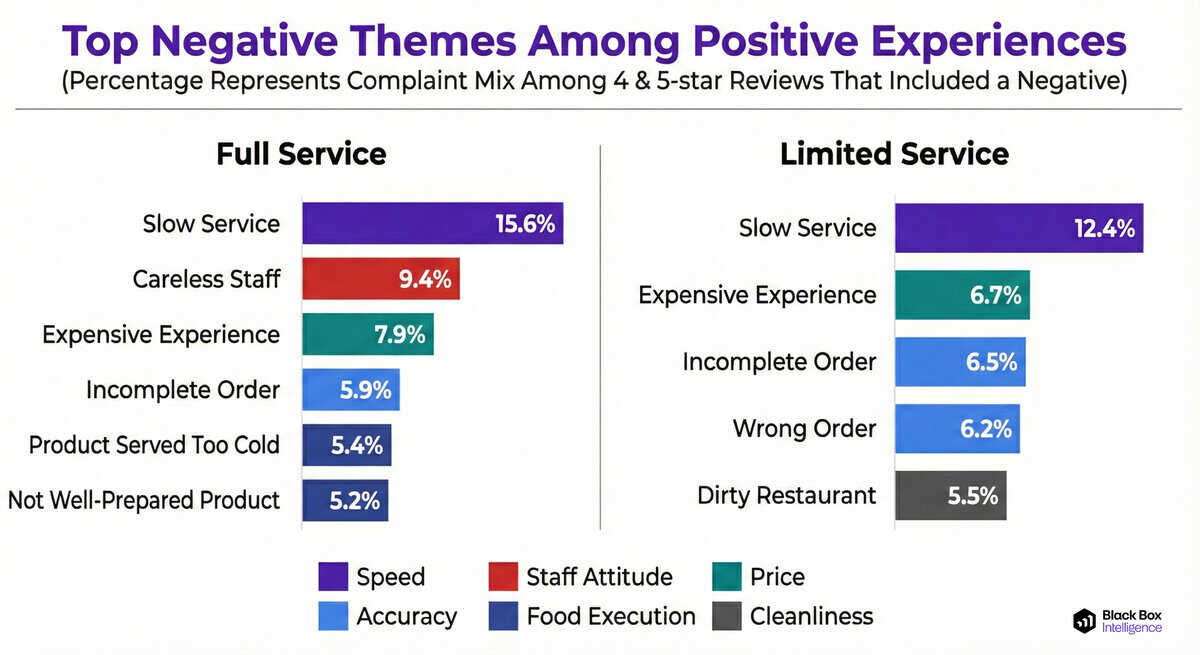
In full service, even when the guest is leaving you 4 or 5 stars, about 1 in 6 is complaining about something related to the wait or pace of the experience. There is room for improvement there.
At the same time, 1 out of 10 is saying the staff was careless. Not enough to ruin the experience, but maybe enough for them to rethink where they want to go next time if your competitor across the street has greater attention to detail when it comes to attentiveness.
In limited service, 1 in 8 guests is also complaining about the speed and wait times.
And notice how for both categories a significant percentage may be happy with the experience and the quality of the food they received, but they are definitely not happy with the price.
Current-Time Context: Prices and Patience
Guests are paying more and tolerating less drag in their experience. In August 2025, food-away-from-home prices rose 0.3% month over month; full-service prices rose 0.4%, limited-service 0.1%. That’s fresh pressure on the “worth it” equation and it narrows the margin for error at the table, on the line, and in the lobby.
Consumer mood isn’t helping either. The University of Michigan’s preliminary reading shows consumer sentiment fell again in September 2025, a second straight monthly drop. In a climate like this, patience for mistakes shrinks. Guests still dine out; they just walk faster when standards slip.
The Black Box Intelligence Point of View
The data proves that you cannot “market” your way out of operational friction. Traffic follows execution, and the Complaint-Traffic Ratio is your scorecard.
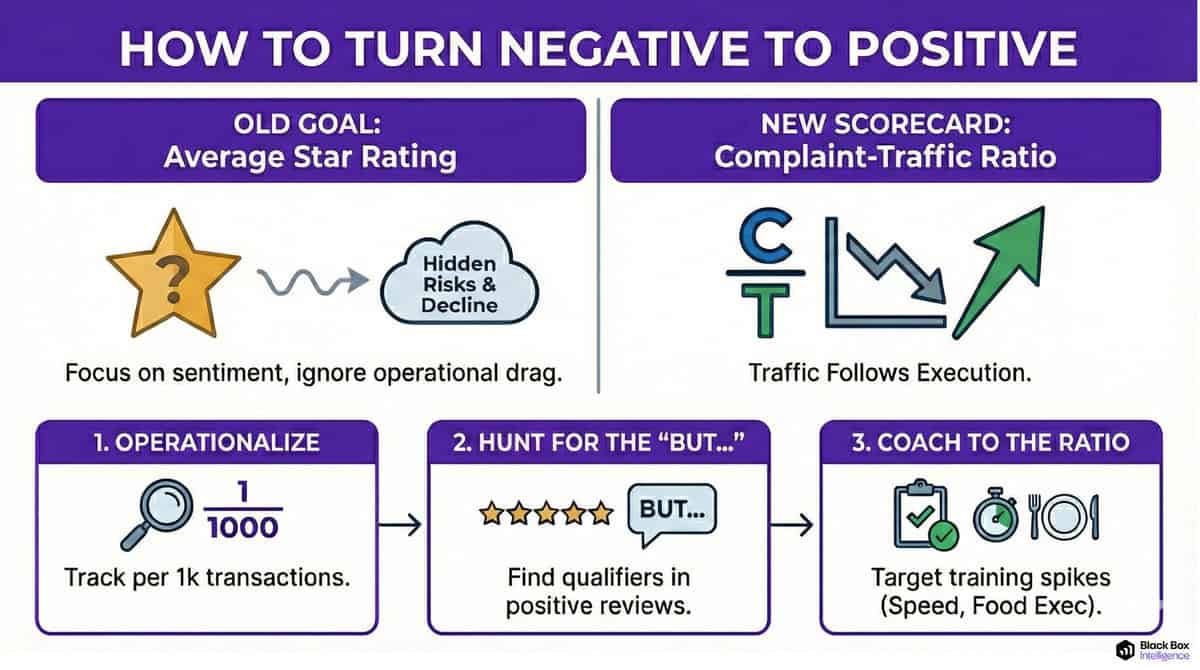
Here are three recommendations to help you replicate the success of the top performers:
1. Operationalize the Complaint-Traffic Ratio Stop using “Average Star Rating” as your primary unit-level goal. Start tracking complaints per 1,000 transactions. Compare this across your fleet. If a unit has a 4.8-star rating but a high complaint ratio (hidden in the text), they are at risk of traffic decline.
2. Hunt for the “But…” “The Rest” see a 5-star review and celebrate. “The Best” read the text to find the qualifier (e.g., “Great food, but the server seemed rushed”). These hidden negatives are the easiest way to lower your complaint ratio before they turn into 1-star reviews.
3. Coach to the Ratio Use the ratio to aim your training.
-
Is the ratio spiking on weekends? Look at Speed and Accuracy.
-
Is it spiking at dinner? Look at Food Execution.
-
When the Complaint-Traffic Ratio falls and stays low, traffic follows.
Note on Methodology: When we refer to “The Best,” we are isolating the top quartile of brands or units based on year-over-year traffic growth relative to their segment and market (DMA) peers. This data doesn’t rely on anecdotes; it is strictly defined by performance metrics within the Black Box Intelligence network.
Learn More About Top Performers
Deep Dive into More Behaviors of Top 25% Restaurant Performers
Return to Best vs Rest main menu or read other articles below.

Restaurant Performance Management
Close The Gap
The Black Box Intelligence Restaurant Performance Network provides the ground-truth data you need to stop guessing and start executing. Build your own path to outperformance.
