Restaurant Performance: Best vs Rest Analysis
The GM Factor – Why Strong Leadership is the Anchor of High Performance
In our “Best vs. The Rest” series, we are decoding the DNA of the industry’s top performers. We’ve looked at how they manage feedback and how they adapt to value. Now, we turn to the most critical variable in the equation: the leaders inside the four walls.
Level-Setting
If there is one metric that acts as a leading indicator for almost every other success measure in a restaurant—traffic, sales, and hourly retention—it is General Manager stability.
The data from our Q2 2025 analysis is unambiguous: High-performing restaurant companies don’t just hire managers; they invest heavily in building and retaining strong leaders. They understand that a stable leadership team isn’t just an HR goal—it is a critical financial strategy.
Here is what the data reveals about how “The Best” build strong leaders, and why “The Rest” are falling behind.
The True Cost of Leadership Churn
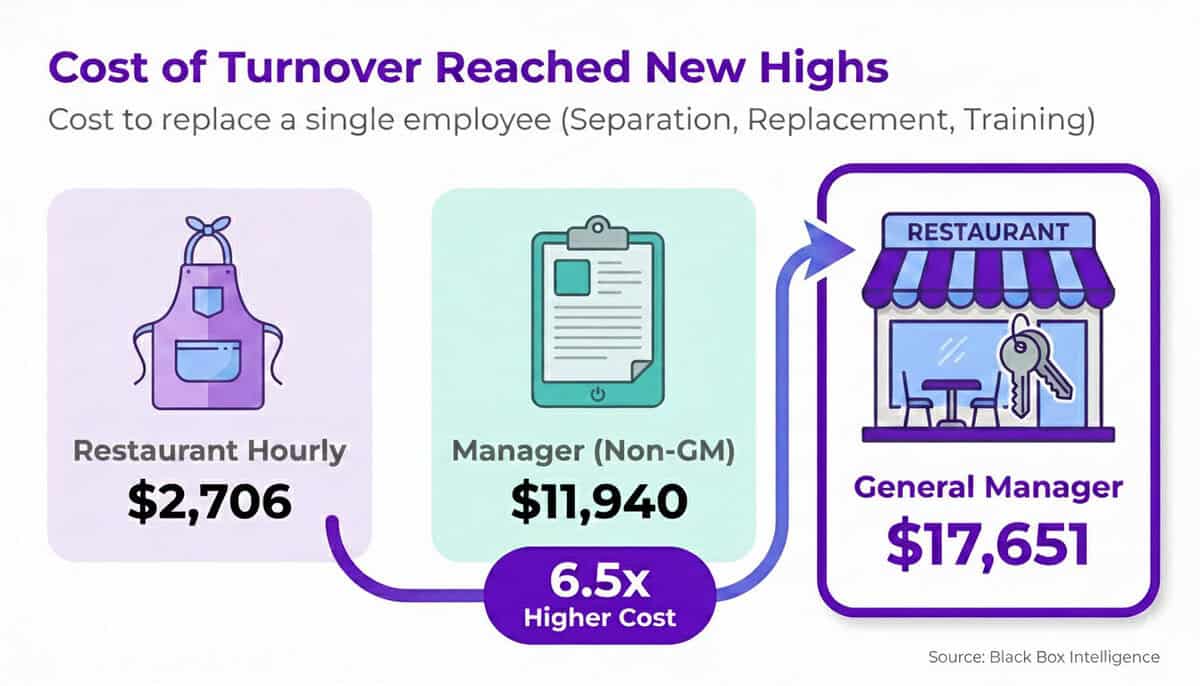
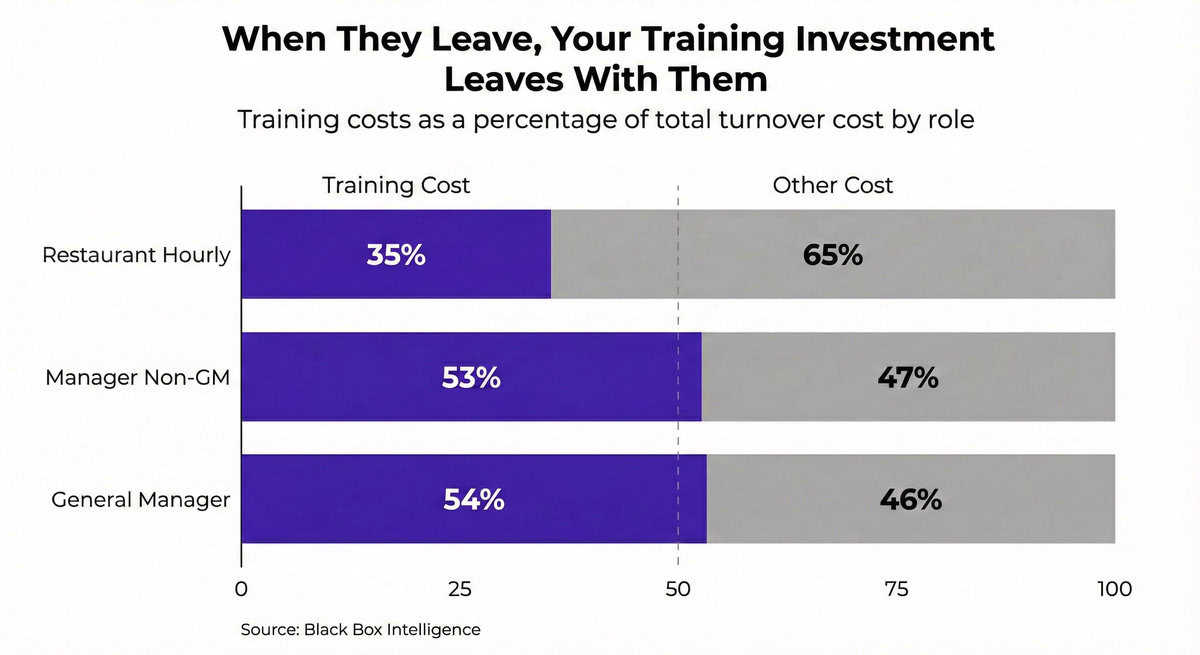
Before we look at the upside of retention, we have to acknowledge the staggering cost of turnover. The direct hard costs (separation, replacement, and training) to replace a single General Manager have reached $17,651.
For a multi-unit brand, that number alone is daunting. But the indirect costs are where the real damage is done. When a GM leaves, the ripple effect destabilizes the entire unit.
The “Stability Dividend”: Traffic, Sales, and Team Retention
The most compelling finding in our analysis is the performance gap between units with stable leadership versus those churning through GMs.
When we compared units with zero GM turnover over a rolling 12-month period against those that lost a GM, the results were striking:
-
Full Service Stability: Units with no GM turnover generated 3.5% higher sales growth and 3.3% higher traffic growth than their peers with turnover.
-
Limited Service Stability: The gap was smaller but still positive, with stable units seeing 1.9% better traffic growth.
Perhaps most importantly, a stable GM stabilizes the hourly workforce. In Full Service brands, units with no GM turnover saw hourly turnover rates 21 percentage points lower than units where the GM left. In Limited Service, that difference was 16 percentage points.
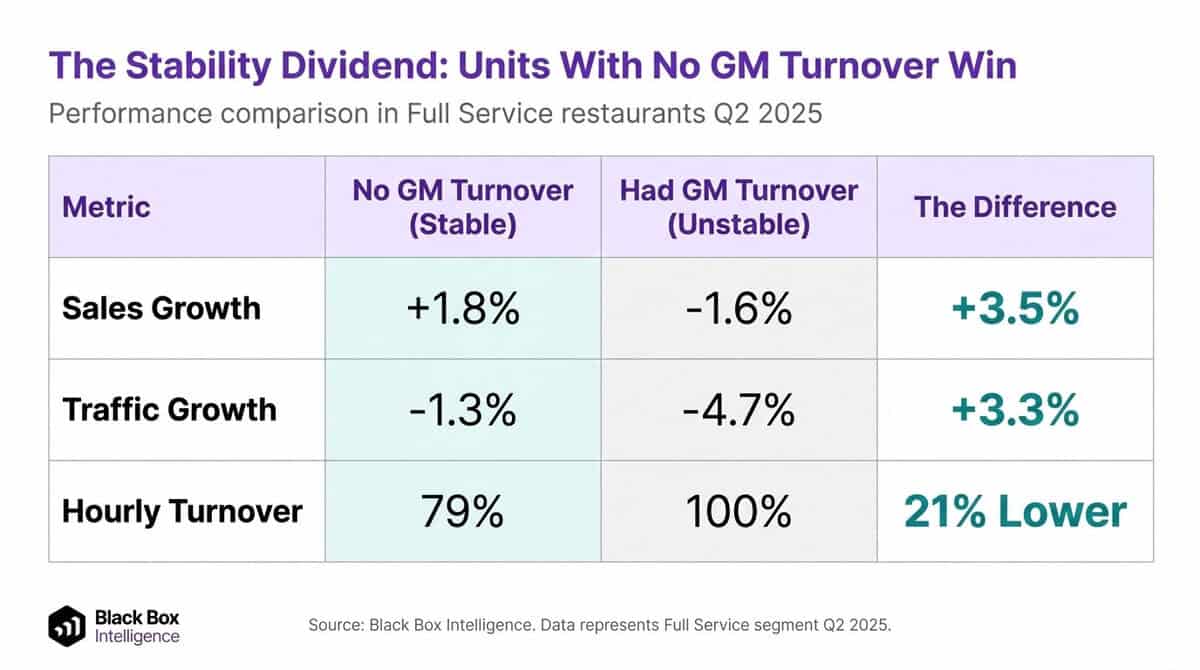
The takeaway is clear: You cannot stabilize your hourly workforce or grow your traffic if your General Managers are walking out the door.
Money Talks: The Impact of Bonuses and Incentives
So, how are “The Best” keeping their leaders? The data points directly to compensation strategy—specifically, how bonuses are structured and targeted.
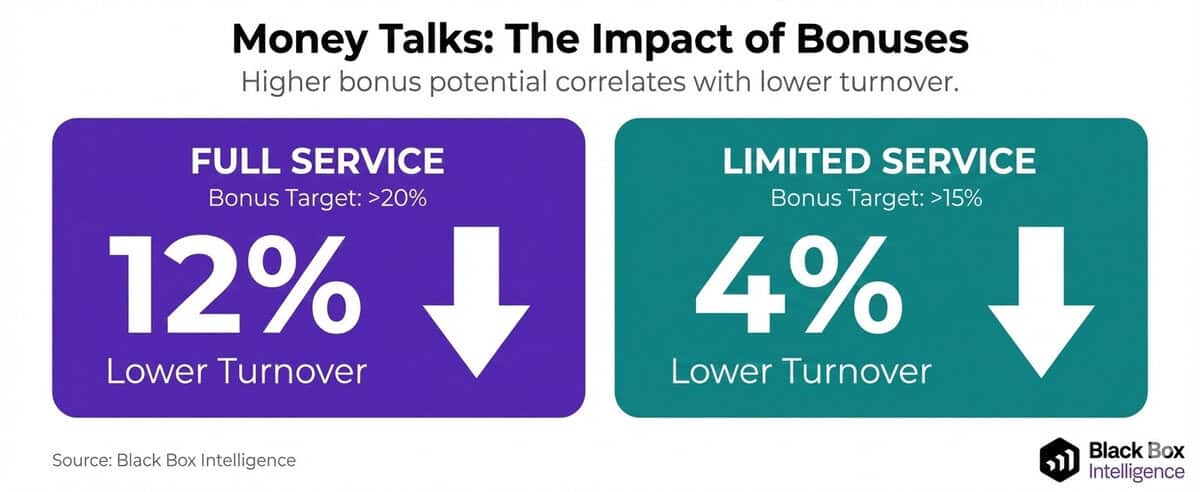
Simply put, higher bonus potential correlates with lower turnover.
-
Full Service: Companies offering GM target bonuses above the industry median (20%) saw 12% lower GM turnover.
- Limited Service: Companies exceeding the median target bonus (15%) saw 4% lower turnover
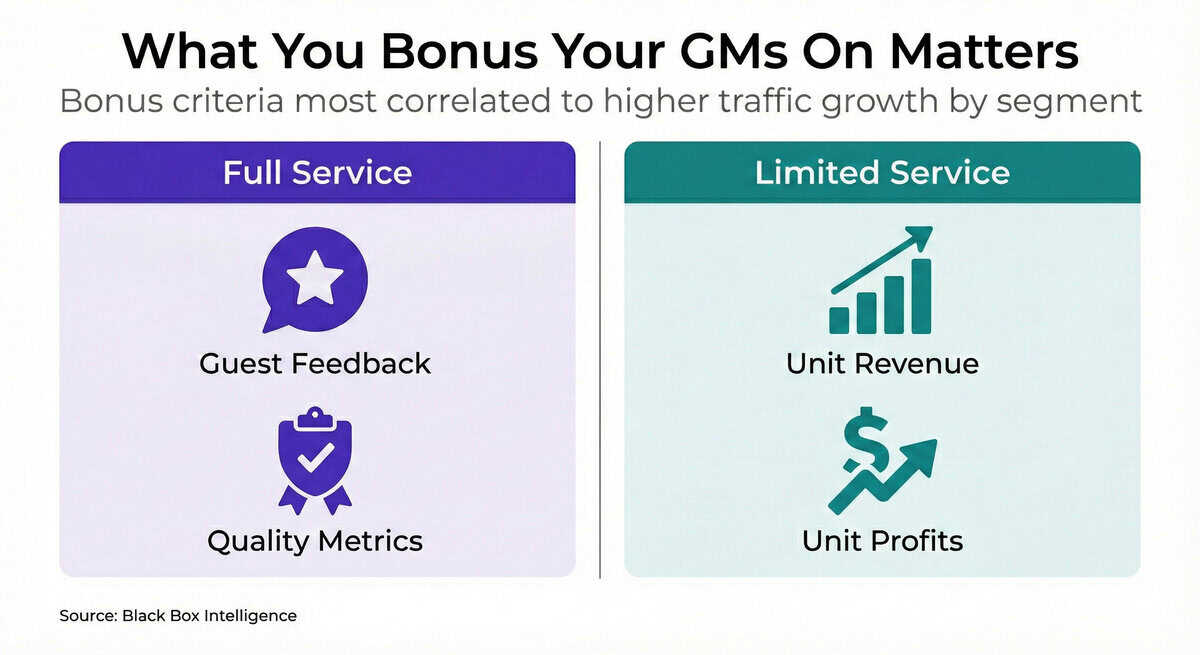
What You Bonus On Matters Even More
This is where the data gets nuanced. It’s not just about paying a bonus; it’s about aligning that bonus with the operational reality of the segment.
- In Full Service: The bonus criteria most correlated with high traffic growth are Guest Feedback and Quality Metrics. In an experience-driven environment, incentivizing GMs to focus on the guest yields the best returns.
- In Limited Service: The correlation shifts. The top performers bonus their GMs on Unit Revenue and Unit Profits. In these high-volume, efficiency-driven models, a focus on the P&L drives the best traffic outcomes.
Perhaps most importantly, a stable GM stabilizes the hourly workforce. In Full Service brands, units with no GM turnover saw hourly turnover rates 21 percentage points lower than units where the GM left. In Limited Service, that difference was 16 percentage points.
Beyond the Paycheck: Wellbeing as a Retention Tool
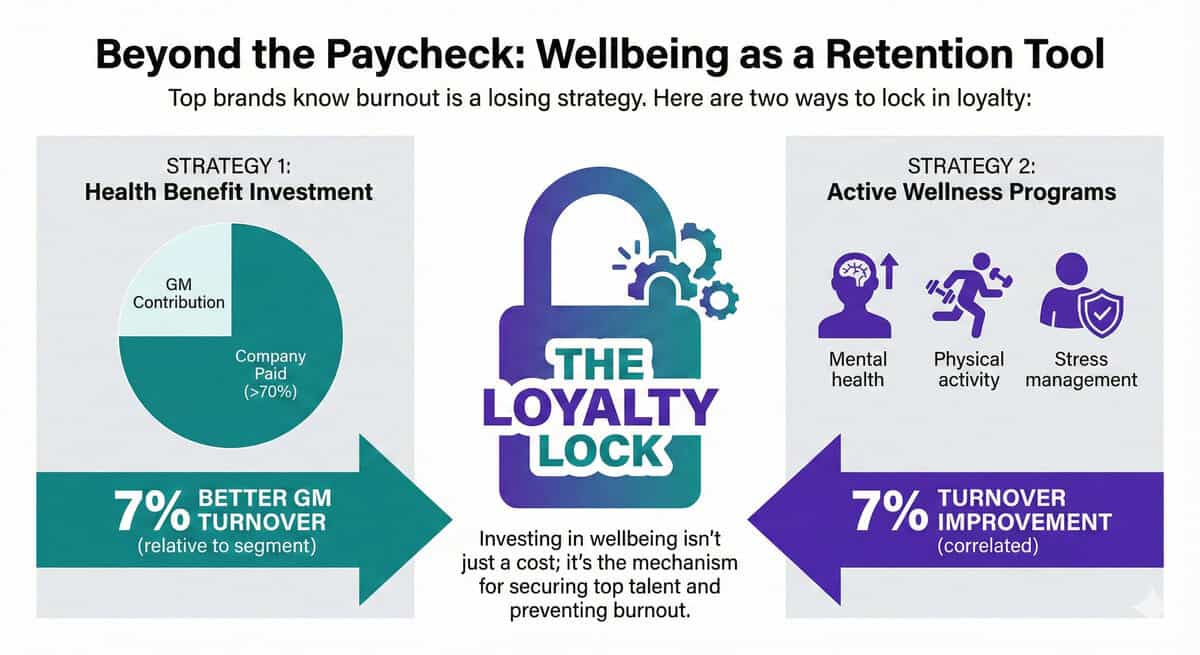
Finally, the top 25% of brands have realized that burning out their GMs is a losing strategy. They are increasingly using benefits to lock in loyalty.
- Health Benefits: Companies that pay over 70% of a GM’s health premiums see 7% better GM turnover relative to their segment.
- Wellness Programs: Merely offering wellness programs is correlated with a 7% improvement in GM turnover.
The Black Box Intelligence Point of View
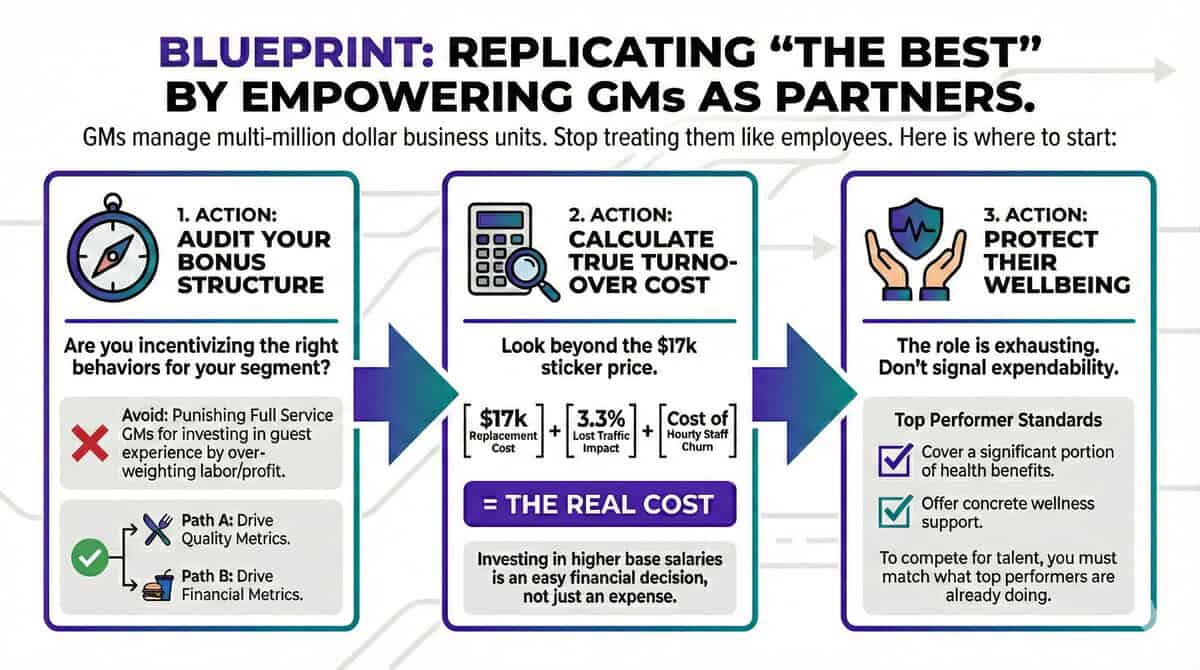
The data tells us that the “General Manager” title is a misnomer—they are the CEOs of multi-million dollar business units. High-performing brands treat them as partners, not just employees.
If you want to replicate the success of “The Best,” here is where you should start:
1. Audit Your Bonus Structure: Are you incentivizing the right behaviors for your segment? If you are in Full Service but your GM’s bonus is 100% tied to labor cost and profit, you may be inadvertently punishing them for investing in the guest experience—which is exactly what drives your traffic. Align your incentives with the data: Quality for Full Service, Financials for Limited Service.
2. Calculate Your “Total Cost of Turnover” Don’t just look at the $17k replacement cost. Factor in the lost traffic (3.3%) and the cost of rehiring the hourly employees who leave when the GM leaves. When you see the true cost, investing in higher base salaries or better benefits becomes an easy financial decision, not an expense to be managed.
3. Protect Their Wellbeing The GM role is exhausting. If you aren’t covering a significant portion of their health benefits or offering wellness support, you are telling them they are expendable. The top performers are already doing this. To compete for talent, you must match them.
Note on Methodology: When we refer to “The Best,” we are isolating the top quartile of brands or units based on year-over-year traffic growth relative to their segment and market (DMA) peers. This data doesn’t rely on anecdotes; it is strictly defined by performance metrics within the Black Box Intelligence network.
Learn More About Top Performers
Deep Dive into More Behaviors of Top 25% Restaurant Performers
Return to Best vs Rest main menu or read other articles below.

Restaurant Performance Management
Close The Gap
The Black Box Intelligence Restaurant Performance Network provides the ground-truth data you need to stop guessing and start executing. Build your own path to outperformance.
