Restaurant Performance: Best vs Rest Analysis
Top Brands Defy and/or Stay Ahead of the Market
In our “Best vs. The Rest” series, we are decode the DNA of the industry’s top performers. We explore how they manage feedback, how they adapt to trends, retain their GMs and how they set team members up for success. Here, we turn to the outliers: the brands that are defying the trends to find growth where others see decline.
Level-Setting
When the market zig-zags, most operators simply hang on. But when we analyze the top 25% of restaurant brands (defined by traffic growth relative to their segment) versus everyone else, we see a distinct pattern: The winners aren’t just reacting to market shifts—they are ahead of them.
The hallmark of a top-performing brand in 2025 isn’t just operational excellence; it is the ability to identify where the guest is going before the rest of the industry catches up. While the average brand (“The Rest”) retreats to safety or tries to force 2019 behaviors on today’s guests, “The Best” are actively defying the narrative.
Here are two prime examples of how top performers are bucking the trends to widen the gap.
Example 1: Finding Growth Where Others See Cuts
The prevailing headline right now is that guests are “managing the check.” The assumption is that add-ons—specifically beverages—are the first thing to go when wallets tighten.
For the majority of the industry, that assumption is becoming a self-fulfilling prophecy. But the top 25% of brands are proving that guests are still willing to spend—if the offer is right.
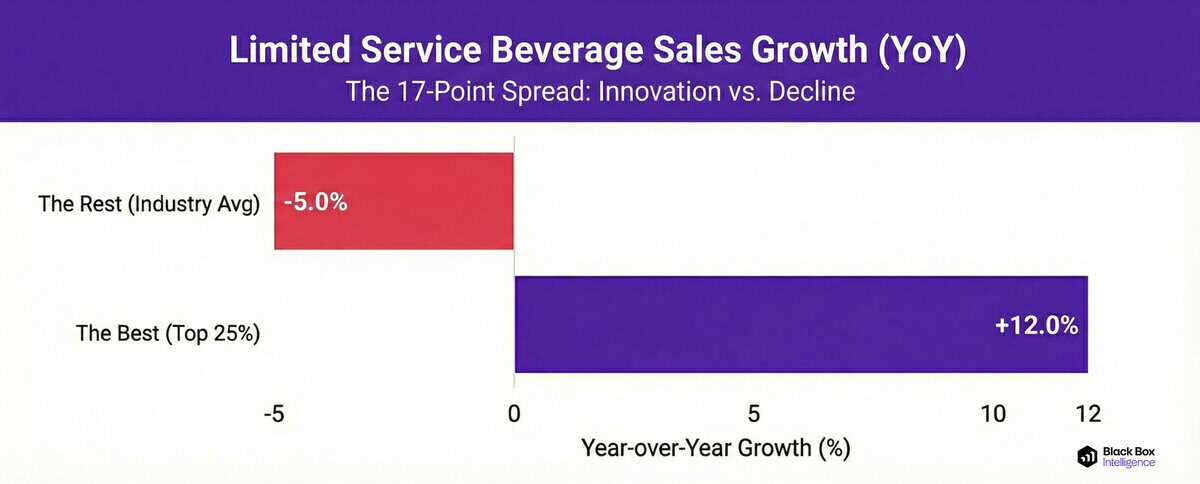
In Limited Service (QSR & Fast Casual):
-
The Best: Are seeing +12% year-over-year growth in beverage sales.
-
The Rest: Are seeing a -5% decline.
That is a massive 17-point spread. While “The Rest” accept that beverage incidence is down, the winners have likely innovated their way to growth, turning beverages into destination drivers rather than just check-builders.
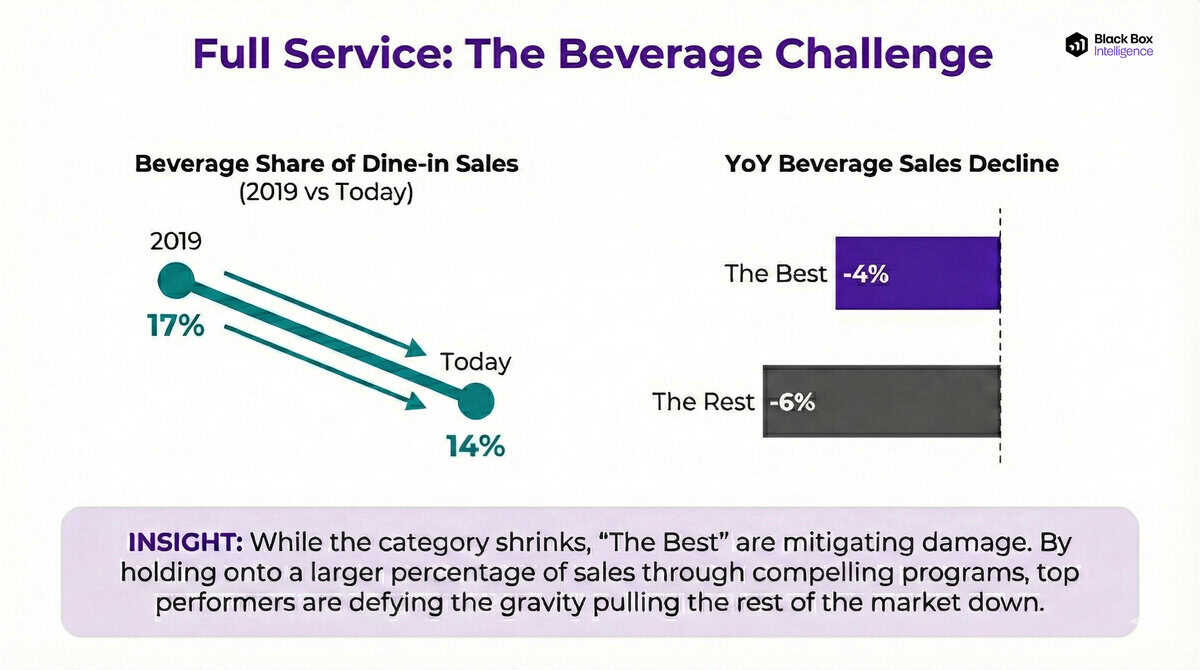
In Full Service (Casual Dining, Upscale, Fine Dining): The challenge here is steeper. The long-term trend for alcoholic beverage consumption in restaurants is undeniably negative; back in 2019, beverages made up 17% of dine-in sales, but today that sits at just 14%.
However, even in a shrinking category, the winners are mitigating the damage far better than their peers.
-
The Best: Are seeing a -4% decline in beverage sales.
-
The Rest: Are seeing a -6% decline.
While both groups are facing year-over-year declines, the brands with the best traffic growth are successfully holding onto a larger percentage of their beverage sales. This suggests that “The Best” aren’t just accepting the macro trend; they are countering it with compelling beverage programs and ambiance that give guests a reason to order that drink, defying the gravity pulling the rest of the market down.
Example 2: Rejecting the “Return to Normal”
Another common narrative is the “return to the dining room.” Many operators view a high dine-in mix as a sign of health and stability. Consequently, many brands are trying to steer traffic back inside the four walls.
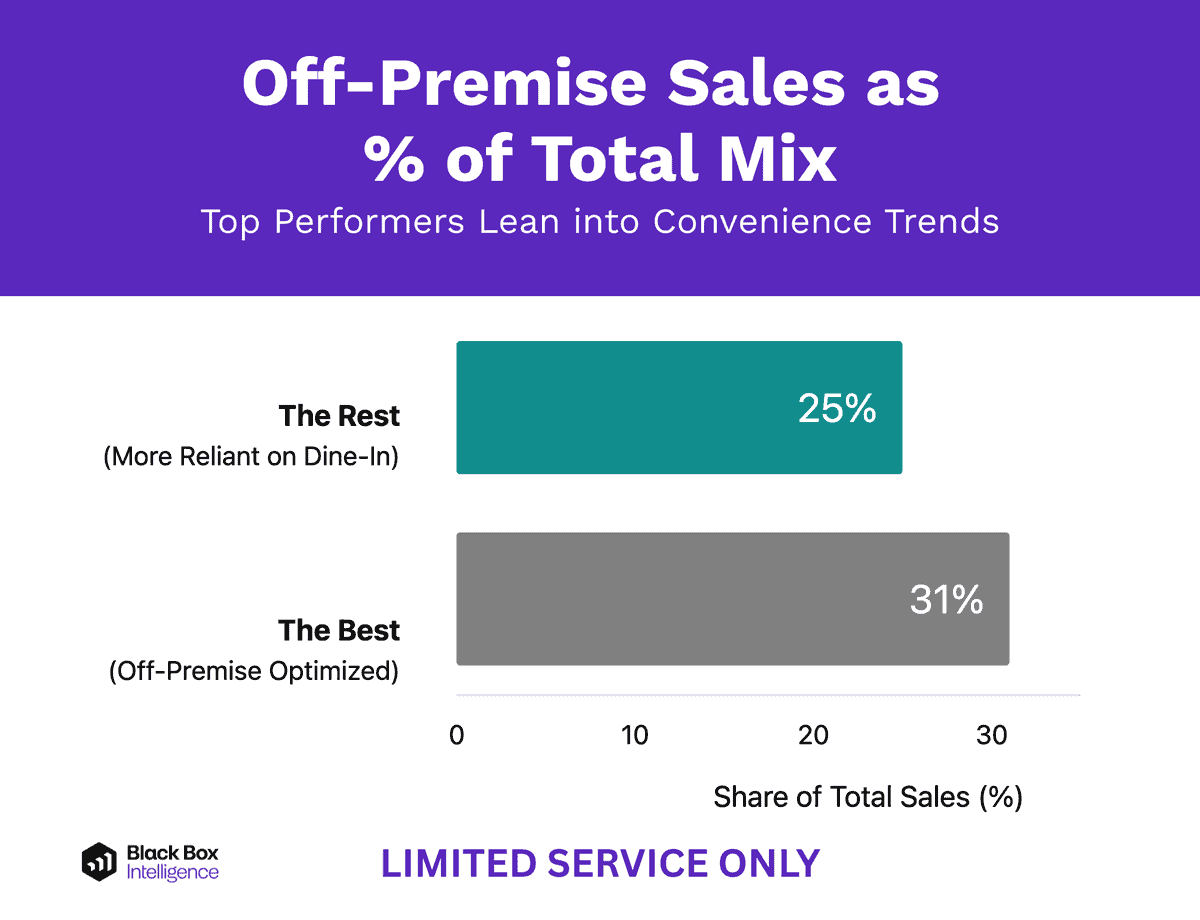
The data suggests the top performers aren’t fighting the friction. They are leaning into the permanent shift toward convenience.
-
The Best: Dine-in sales make up only 25% of their total mix.
-
The Rest: Dine-in sales account for 31% of their total.
This is a counter-intuitive finding for many. The lower-performing brands are more reliant on their dining rooms. The winners have successfully adapted their real estate, technology, and operations to meet the guest where they actually are—off-premise—rather than where the operator wishes they would be.
The Black Box Intelligence Point of View
The data proves that “market headwinds” do not hit everyone equally. The difference between “The Best” and “The Rest” is often simply the awareness to pivot quickly.
Here are three recommendations to help you defy the trends:
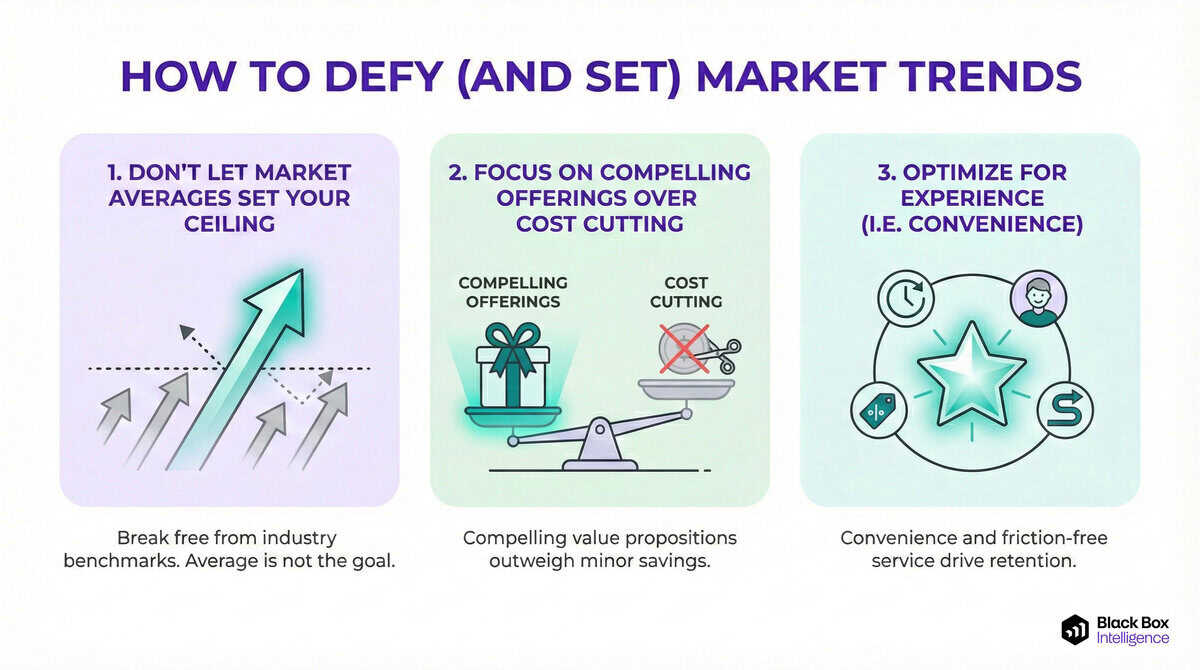
1. Don’t let “Market Averages” Set Your Ceiling: If you only benchmark against the industry average, you are aiming for mediocrity. The beverage data proves that just because the industry is down, it doesn’t mean you have to accept the full brunt of the decline.
2. Focus on “Compelling Offerings” over Cost Cutting: In Full Service, the -2% difference in beverage sales between the Best and the Rest likely comes down to experience. The top brands are investing in offerings that drive desire—creating an atmosphere where a drink feels “worth it”. If you strip your beverage program to save costs, you will only accelerate the slide toward that -6% baseline.
3. Stop Forcing the 2019 Model: If your dine-in mix is higher than the top performers, ask yourself why. It might not be because dine-in is thriving; it might be because your off-premise experience is friction-heavy. The top brands are winning by optimizing for throughput and convenience, accepting that the definition of “restaurant experience” has fundamentally changed.
Note on Methodology: When we refer to “The Best,” we are isolating the top quartile of brands or units based on year-over-year traffic growth relative to their segment and market (DMA) peers. This data doesn’t rely on anecdotes; it is strictly defined by performance metrics within the Black Box Intelligence network.
Learn More About Top Performers
Deep Dive into More Behaviors of Top 25% Restaurant Performers
Return to Best vs Rest main menu or read other articles below.

Restaurant Performance Management
Close The Gap
The Black Box Intelligence Restaurant Performance Network provides the ground-truth data you need to stop guessing and start executing. Build your own path to outperformance.
