November 2025 Monthly Second Helping: Highlighting Hot Topics in the Industry
What BBI Data Tells Us About: Government Shutdown Impact on Restaurant Industry
BBI data shows the record-long government shutdown worsened already-soft restaurant traffic—especially in federal-worker-heavy markets like D.C.—but its drag on the industry faded once the government reopened.
Last week the longest government shutdown in American history ended after 43 days. During this period 670,000 government workers were furloughed, 730,000 federal employees worked without pay, 6% of scheduled flights were cancelled and 72 million SNAP recipients lost their benefits.
The consequences of the shutdown also went beyond just the federal government. According to the Congressional Budget Office, the GDP suffered by 11 billion dollars and according to National Economic Council Director Kevin Hassett, 60,000 workers outside the federal government lost their jobs due the economic effects of the shutdown.
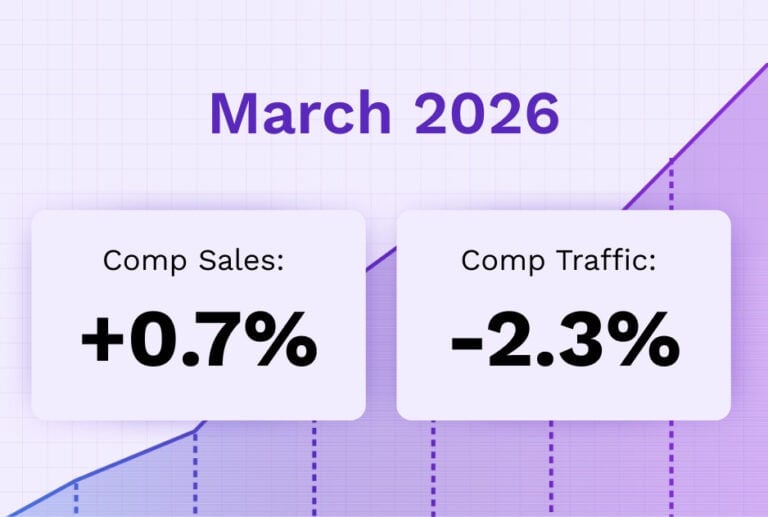
So how did it affect the restaurant industry? Black Box Financial Intelligence data shows industry traffic has declined since the shutdown which began on October 1st. In September, National same-store traffic growth year over year was at -1.3%. In October and November, it was -2.0% and -3.5%, respectively.
However, restaurant traffic has been declining since July. So how much did the shutdown drag down performance? It’s hard to say conclusively but a few Black Box Intelligence datapoints might shed some light.
More Federal Workers, Worse Traffic
One indicator that the shutdown has had a negative effect is that areas with a higher percentage of federal employees saw a steeper decline.
The 2025 year-to-date restaurant same-store traffic growth for both the Washington D.C. DMA (the DMA with the highest number of federal employees) and the Nation are nearly identical at -1.7% (as of the second week of November).
However, if you look at just the past two months the National average was -2.0% in October and -3.5% in November. For the Washington D.C. DMA it was -2.7% in October and -4.5% in November.
Furthermore, if we look at traffic growth within the zip codes with the highest percentage of federal workers according to ZipAtlas, and compare those zip codes to the rest of our system, we see a starker drop in traffic growth.
Year-on-Year Traffic Growth During Government Shutdown

State of the Restaurant Industry Webinar Series
Want More Detail? Register for our Quarterly Deep Dives on the Restaurant Industry
Traffic Worsened During Shutdown, Especially for Directly Impacted Communities
The six weeks before the shutdown, zip codes with the highest percentage of federal workers were underperforming the rest of the country by -0.5%. After the shutdown, they underperformed by -1.3%.
This gap would be even greater (-1.7%) if it weren’t for the first week of the shutdown when those zip codes surprisingly outperformed the rest of the country in traffic growth. Considering that the median duration of a government shutdown is only 4 days, perhaps during the first few days many federal employees didn’t worry much and even took the time to go out.
However, by week two, they were disabused of this notion and traffic growth in these zip codes fell to -4.3% (3.5% worse than the rest of the country).
While there are still reasons to expect the rest of the year to remain soft in terms of traffic growth, it’s a positive sign that the federal government (or lack thereof) is no longer contributing to that decline.
Unrivaled Restaurant Financial Intelligence
Explore How To Build Custom Comp Sets With BBI


More Insights and Research from Black Box Intelligence