Restaurant Survey Best Practices
How to Structure Your Restaurant Survey
A Blueprint for Actionable Guest Intelligence
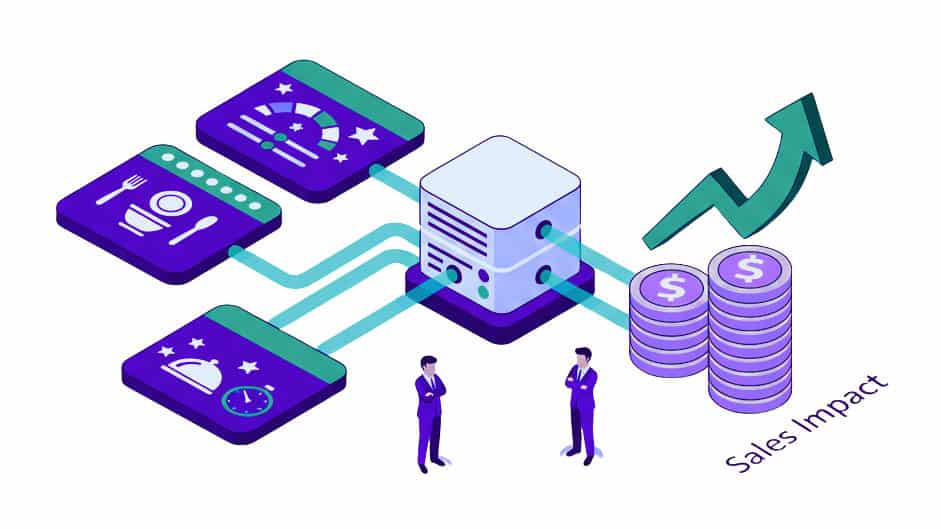
In the current restaurant landscape, the margin for error is nonexistent. With inflation squeezing profitability and customer acquisition costs rising, the “Voice of the Guest” has shifted from a passive report card to a critical operational lever.
Yet, many restaurant brands are still deploying survey architectures designed in 2010—long, static lists of questions that fatigue guests and confuse operators.
The problem isn’t usually the questions themselves; it’s the structure.
A poorly structured survey is a data graveyard. It collects scores but hides the “why.” A well-structured survey, by contrast, is a diagnostic tool. It moves beyond asking “How did we do?” to mathematically determining “What should we fix to drive traffic?”
Impactful Data That Drives Action
For restaurant groups in 2026, data is rarely the problem. Most brands are drowning in data. The problem is organizing the data in a way you get the right answers.
You likely have a “guest sentiment” score. You know your NPS is 9, or your OSAT is 4.1 stars.
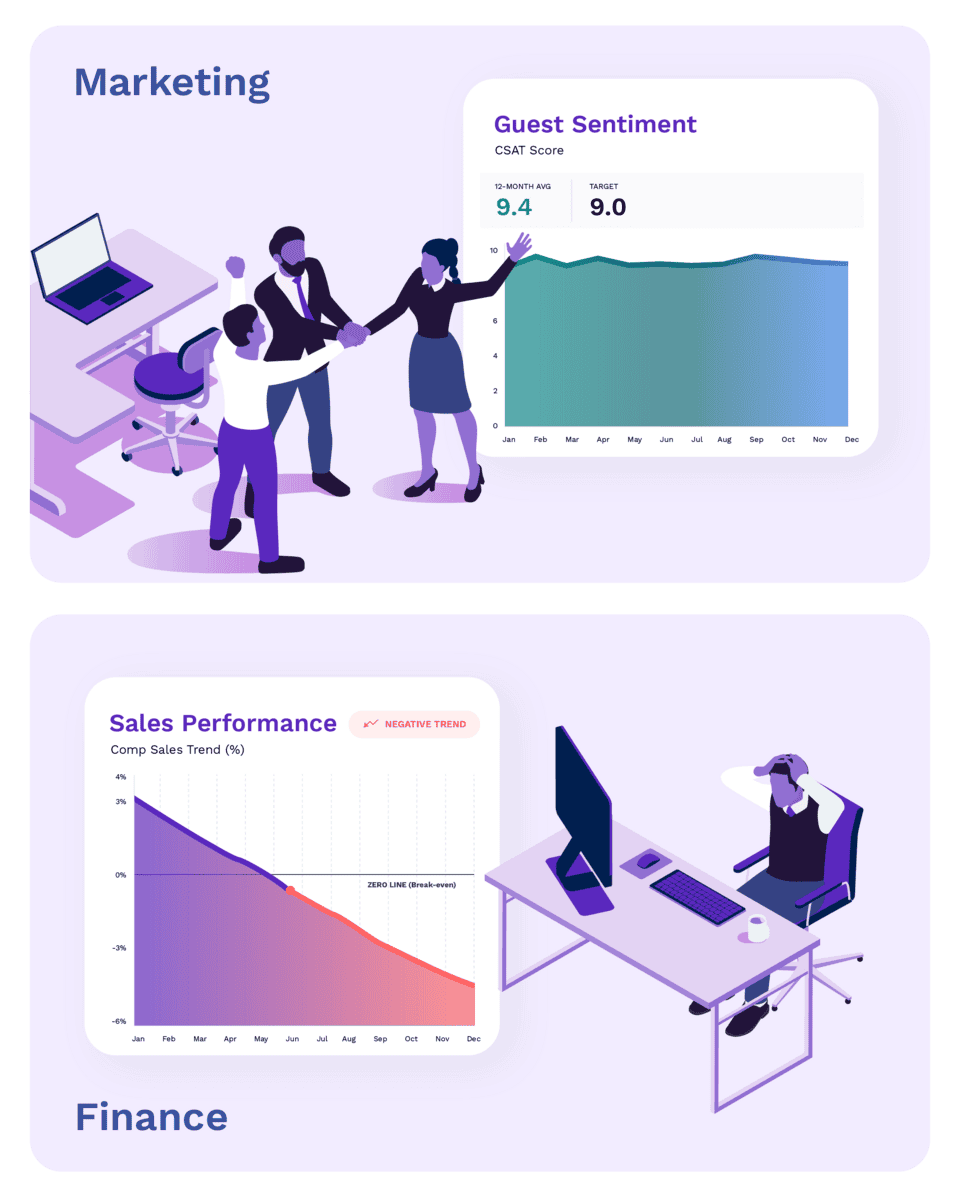
But does that number tell your General Manager exactly what to fix during the lunch rush to save the shift? Does it tell your Marketing leadership exactly how to impact that score—identifying which brand lever (value, menu innovation, or service consistency) will actually move the needle next quarter?
And critically, do you know how these metrics map to your financial results? Can you prove to your CFO that a 5-point lift in sentiment actually correlates to a lift in traffic or comp sales?
What is Covered in This Article
To serve the tactical needs of Operations, the strategic needs of Marketing, and the financial goals of the C-Suite, you must fundamentally rethink your restaurant survey structure. It is not about asking more questions; it is about asking the right questions.
1. The Anchor: The Mechanism for Catching the Signal
Before you can fix a shift or analyze a trend, you must establish a baseline. The most critical component of your survey structure is the mechanism you use to catch the North Star.
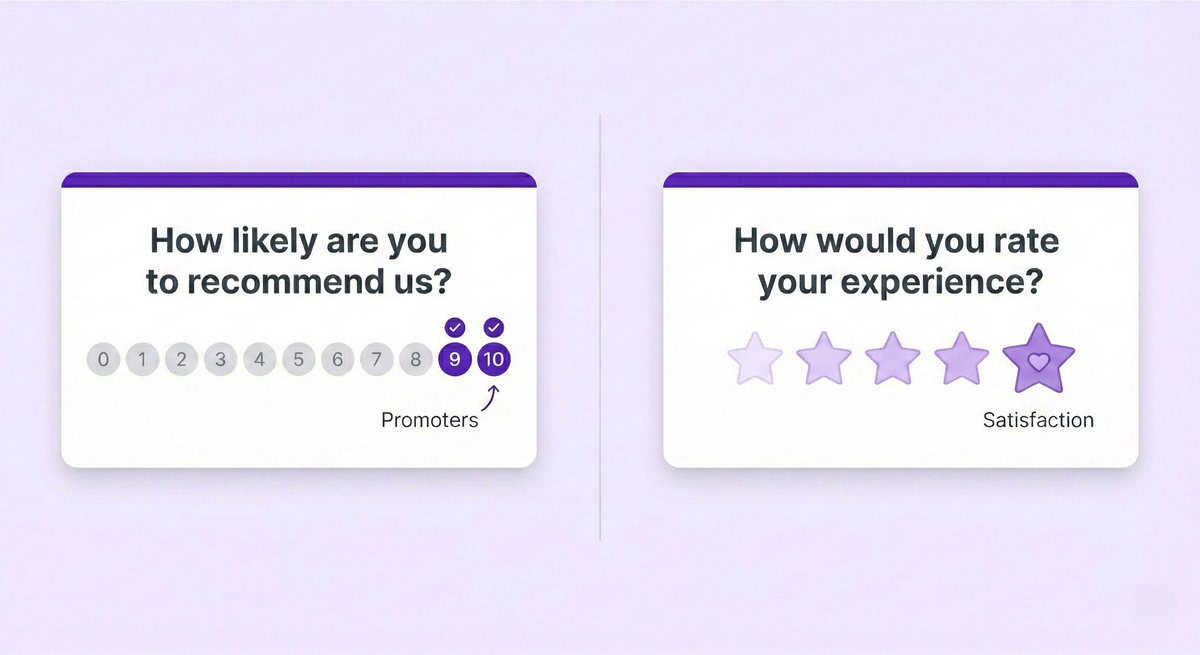
This is your Net Promoter Score (NPS) (“How likely are you to recommend…”) or Overall Satisfaction (OSAT) (“How would you rate your experience…”).
Structurally, this metric serves a specific purpose: It captures the total sentiment of the guest.
It is the aggregate result of everything that happened during their visit—the food, the service, the price, the atmosphere, and the brand affinity. It answers the high-level question: “Is the guest happy?”
Many brands bury this question in the middle of a survey or dilute it by placing it alongside five other “rating” questions. This is a structural error. The Brand Score is the “Signal.” Everything else is “Noise” until proven otherwise.
The “North Star” Mechanism
Structurally, the Brand Score question must be the Anchor.
- Placement: It must be the very first interaction. No preamble, no demographic questions, no marketing fluff.
- Visibility: It must be “above the fold” on mobile. The guest should not have to scroll to find it.
- Simplicity: It requires a standardized scale (0-10 or 1-5 Stars) that remains consistent across every location and channel.
Why You Must “Catch” the Score First
The reason for this structural rigidity is twofold:
- The “Blink” Reaction (Marketing Value) Guest sentiment is emotional, not rational. You want to capture their visceral reaction to the brand (“I loved it” or “I hated it”) before you force them to analyze the details. If you ask them to rate the speed of service first, you force them into a rational critique mode, which biases the overall score. Marketing needs the raw, emotional truth to benchmark brand health accurately.
- The Abandonment Safety Net (Data Integrity) The reality of digital surveys is abandonment. Guests get distracted. If a guest answers only one question before closing their browser, it must be this one. Even if you get zero operational details, capturing the Brand Score allows you to track high-level health, measure location performance, and benchmark against competitors.
- If the score is at the end: An abandoned survey is worthless.
- If the score is at the start: An abandoned survey is still a valid data point for your “Is it me, or the market?” analysis.
2) Uncovering the “Why”: Experience vs. Menu
Once you have established the Anchor Score, the goal of the remaining questions is diagnosis. You need to understand which part of the guest journey influenced that rating.
To get a complete picture, your survey must ensure coverage across the two primary drivers of restaurant performance: The Experience and The Menu.
While more advanced brands use “conditional logic” (hiding questions based on previous answers) to keep surveys short, the most important factor is simply ensuring your question bank covers both territories. If you only ask about food, you miss service failures. If you only ask about service, you miss product issues.
You need a balanced view of both across your survey questions:
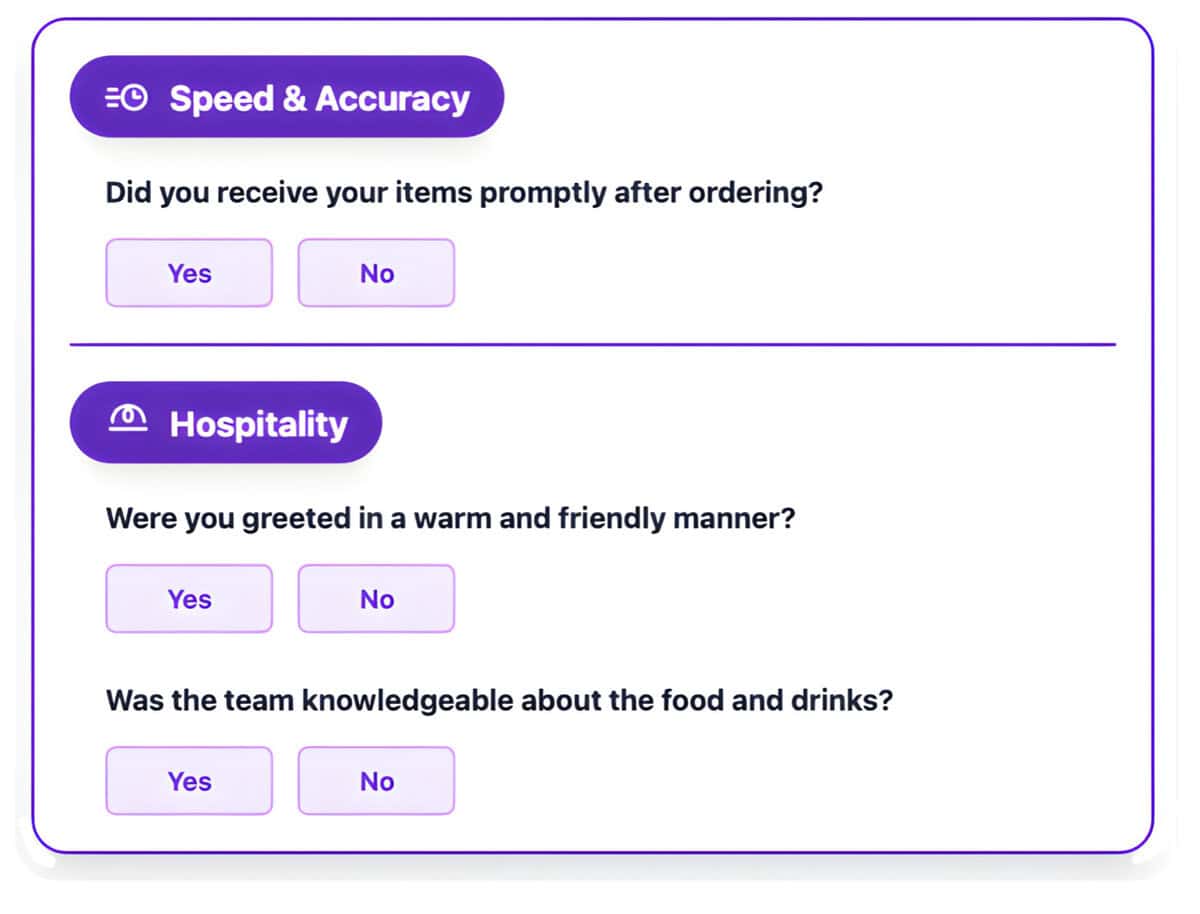
The Experience (The “How”)
This category measures the execution of your hospitality and operations. It answers: Did the brand deliver on its service promise?
- Speed & Pace: Was the flow of the experience aligned with expectations? (e.g., “Speed of Service,” “Check-Back Timing”).
- Environment: Did the physical space support the experience? (e.g., “Cleanliness,” “Music Volume,” “Lighting”).
- Hospitality: Did the team make the guest feel valued? (e.g., “Staff Friendliness,” “Greeting,” “Problem Resolution”).
The Menu (The “What”)
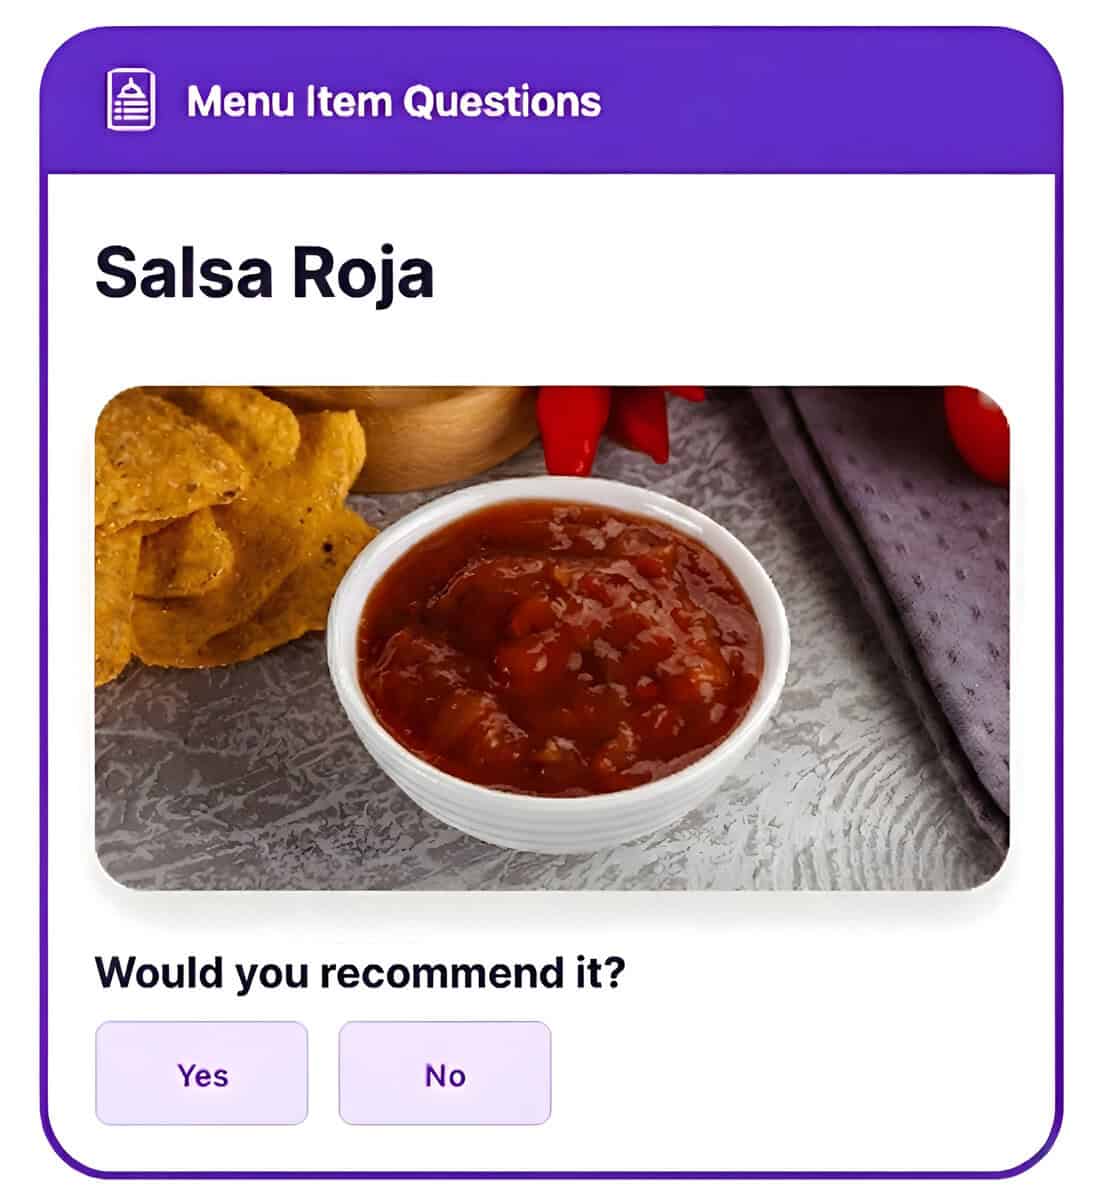
This category measures the strength of your product and value proposition. It answers: Did the food and beverage meet the standard?
- Execution: Was the product prepared correctly? (e.g., “Temperature,” “Freshness,” “Presentation”).
- Taste Profile: Did the flavor meet the brand standard? (e.g., “Flavor,” “Seasoning,” “Texture”).
- Value: Was the experience worth the cost? (e.g., “Portion Size,” “Value for Money”).
Focusing on Data Quality: Menu Prioritization
Asking guests to rate every single item on a receipt will only lead to survey fatigue and diluted data. To get the most actionable insights, it is more effective to prioritize the items that truly move the needle for your brand.
Top restaurant survey technology will allow you to curate this experience by surfacing the items on your menu you most want feedback on (e.g. a new LTO or a core bestseller).
By ensuring these high-impact items are reviewed first, you can:
-
Accelerate feedback cycles on new menu launches.
-
Monitor consistency for the signature dishes that define your brand.
-
Capture higher-quality data before guest drop-off occurs.
Critical: Tailor to Your Brand Promise
The mistake many brands make is using a “generic” template. Your questions must map directly to your specific brand promise.
- If you are a Fine Dining Steakhouse: Your “Experience” questions should focus on Server Knowledge and Pace, and your “Menu” questions should focus on Temperature Accuracy and Wine Pairing.
- If you are a QSR Drive-Thru: Your “Experience” questions should focus entirely on Speed and Order Accuracy, and your “Menu” questions should focus on Temperature and Portability.
By tailoring these questions and ensuring you have coverage across both Experience and Menu, you can mathematically correlate which factor is driving your North Star metric up or down. You move from guessing to knowing.
Pro Tip
Get Some Inspiration from Our Restaurant Survey Question Bank
3) The “Invisible” Structure: POS Integration
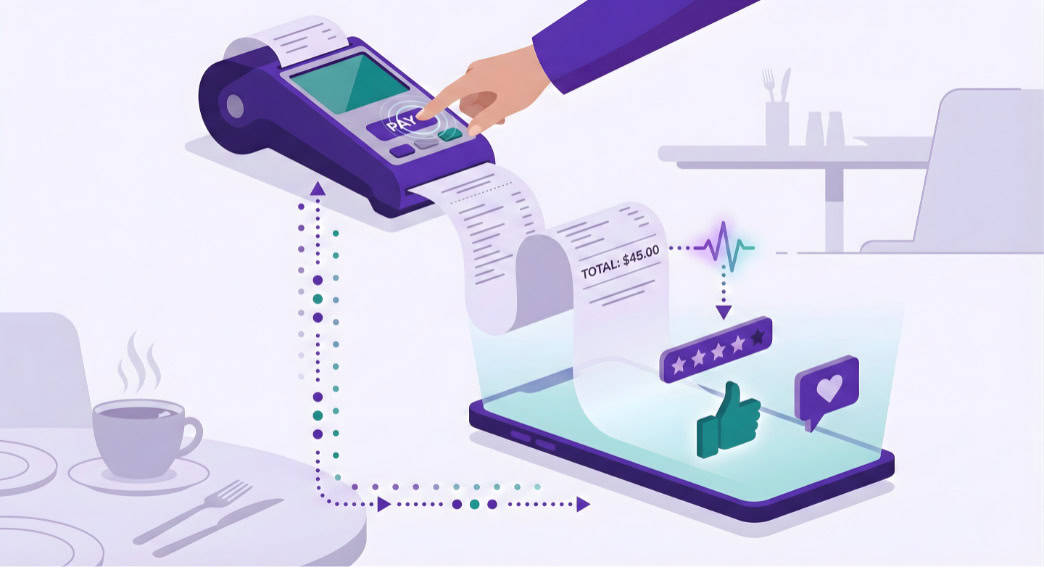
The hallmark of a legacy survey is asking the guest to do the data entry work. “What day did you visit? What time? Which location? What did you order?”
In a modern Guest Intelligence framework, this is a structural failure. It adds friction and reduces the likelihood that the guest will complete the survey, putting your critical Anchor Score at risk.
To optimize effectiveness, your survey platform must be integrated with your Point of Sale (POS) system to enable Metadata Piping—passing transaction data directly into the survey hidden fields.
Why this changes the game:
- Zero Friction The guest clicks the link and immediately answers “How was your meal?” because the system already knows who they are and where they ate.
- Item-Level Precision (Culinary/Ops) Because the survey “knows” the guest ordered the Spicy Chicken Sandwich and a Diet Coke, you can ask specific questions about those items.
- Instead of: “How was the food?”
- Ask: “How would you rate the value of the Spicy Chicken Sandwich?”
- Financial Correlation (Marketing/Finance) This is the Holy Grail. You can map Sentiment directly to Check Size.
- The Insight: Do guests who spend over $50 give higher NPS scores? Does a specific LTO correlate with lower value ratings?
- The Strategy: You can only answer this if the check data is structurally tied to the survey response. This allows you to prove the ROI of guest experience investments.
4) Channel Polymorphism: Adapting to the Journey
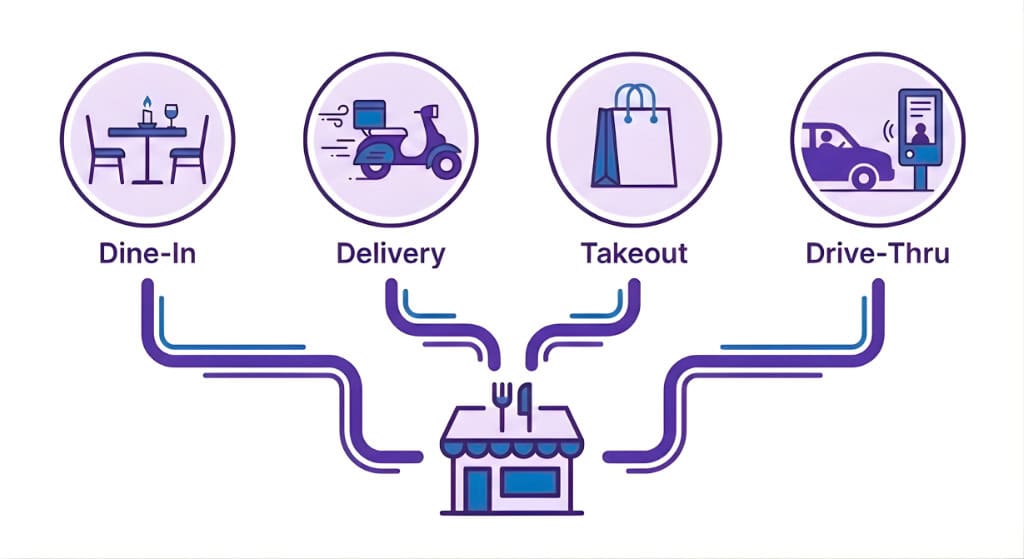
A “one-size-fits-all” survey is a liability that provides you with an overwhelming volume of data that is unlikely to move your business forward.
You must build in the ability to adapt to the channel (Dine-In, Delivery, Takeout, Drive-Thru) as part of your survey structure. This is because the “drivers” of satisfaction are fundamentally different.
Structure A: Dine-In / Table Service
- Goal: Evaluate Hospitality, Atmosphere, and Upsell Execution.
- Key Logic:
- Prioritize “Server Friendliness” and “Pace of Meal.”
- Include “Steps of Service” checks (Yes/No): “Were you greeted promptly?” “Were you offered a second drink?”
- Why: These are training opportunities. If “Upsell” compliance is low on surveys, but high on the P&L, you have a guest friction point that might be hurting your long-term retention.
Structure B: Off-Premise (Delivery)
- Goal: Evaluate Logistics, Packaging, and Product Integrity.
- Key Logic:
- Exclude: Restroom cleanliness, staff friendliness, music volume.
- Include: “Was the food hot upon arrival?” “Was the packaging secure/tamper-evident?” “Was the order accurate?”
- The Insight: This structure helps you distinguish between a kitchen failure (undercooked food) and a courier/aggregator failure (cold/messy food). You cannot blame the kitchen for a DoorDash delay, and your survey structure must protect your internal Ops metrics from external logistics failures.
Structure C: Quick Service (QSR) & Drive-Thru
- Goal: Evaluate Speed, Accuracy, and Friction.
- Key Logic:
- Keep it to 2-3 questions max. Speed is the value proposition here; do not slow the guest down with a long survey.
- Focus on: “Speed of Service,” “Order Accuracy,” and “Menu Board Clarity.”
5) Scaling Insights: Flexible Question Bank
How do you keep surveys short (under 60 seconds) but still track dozens of metrics like cleanliness, greeting, specific menu items, and LTOs?
You use a Flexible Question Bank tailored to your specific offering and value proposition.
The Structure:
- Fixed Questions: The Anchor Score is asked to everyone, every time. This ensures your “Signal” is continuous and unbroken.
- Rotating Questions: The subsequent 2-3 questions are pulled randomly from a larger pool. For example:
- Guest A could see questions about “Speed” and “Cleanliness.”
- Guest B could see questions about “Staff Knowledge” and “Value.”
- Guest C could see questions about “Beverage Quality” and “Digital Ordering.”
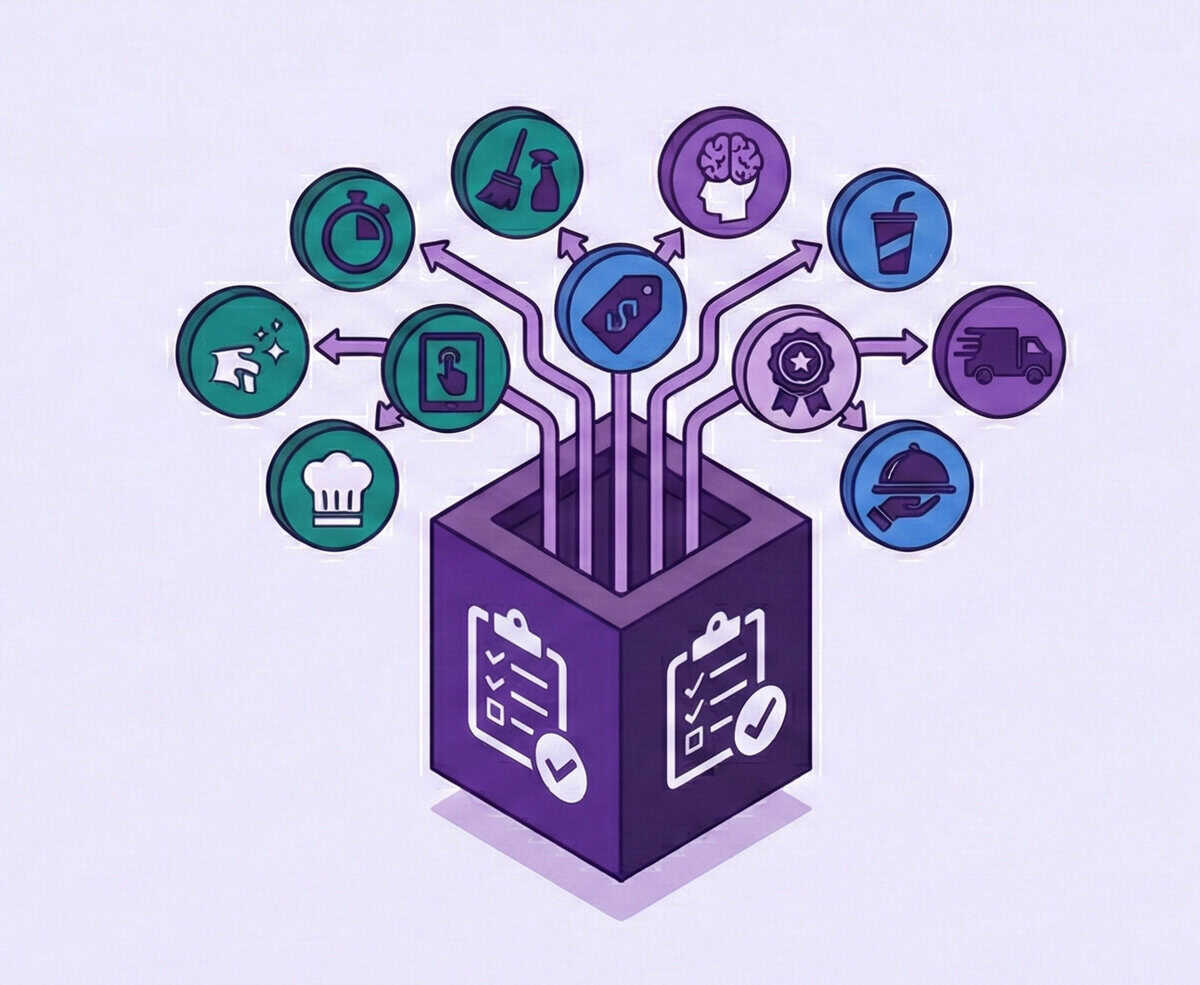
The specifics will vary depending on the goals and philosophy of your business.
Over the course of a week or month, you gather enough data points to build a statistically significant picture of every attribute, without ever burdening a single guest with a 20-question interrogation. This allows you to “pulse” specific questions—like tracking a new LTO launch or a new service protocol—without redesigning the entire survey ecosystem.
Bottom Line
Stop asking your guests for a grade. Start asking them for directions.
A structured, logic-driven survey system starts with a crystal-clear Anchor Score and follows with a precise diagnosis. It allows you to stop guessing where your problems are. It gives you the confidence to tell your C-Suite: “Traffic isn’t down because of the market. It’s down because our speed of service at lunch has dropped 12% in the Northeast region.”
That is the difference between data and intelligence. That is how you win in 2026 and beyond.