State of Restaurant Workforce
Bonuses & Employee Benefits
We explore all the latest variable pay, bonus and employee benefits trends in the restaurant industry – from GMs and other management roles to hourly staff.
Summary
Base pay has normalized and is outpacing CPI; GM bonuses are shifting from profit/revenue toward quality and guest metrics that correlate with higher traffic; and PTO, health plan generosity, wellness programs, and training/orientation hours are all linked to lower turnover and better traffic.
General Manager Bonus Structures
GM bonuses now based less on profit and revenue, more on quality and feedback metrics.
Factors Measured for as part of GM Bonus Structure
(% of Brands That Incorporates Each Factor)
| 2023 | 2024 | 2025 | Growth 2025 vs 2023 | |
|---|---|---|---|---|
| Restaurant Profit | 45.3% | 31.0% | 31.7% | -30% |
| Restaurant Revenue | 23.6% | 20.2% | 17.0% | -30% |
| Company Revenue & Profit | 9.7% | 14.1% | 9.2% | -5% |
| Quality Metrics | 6.7% | 10.7% | 12.4% | +85% |
| Guest Feedback Metrics | 5.3% | 7.0% | 8.0% | +51% |
What the Data Says
-
The average weight on restaurant profit fell from 45.5% (2023) to 31.7% (2025).
-
The weight on restaurant revenue declined from 23.6% to 17.0% over the same period.
-
Company revenue & profit moved down after a 2024 spike, landing at 9.2% in 2025.
-
Quality metrics rose from 6.7% (2023) to 12.4% (2025), and guest feedback metrics climbed from 5.3% to 8.0%.
-
Recommendation: Rebalance GM plans so a meaningful share (≈40–50%) ties to quality/guest metrics that managers can influence weekly. These are proven to be leading metrics for sales and traffic, and provide meaningful focus in the field to that end.
General Manager Bonus Structure Impact on Financial Performance
Our latest research also clearly demonstrated how the criteria used when bonusing your GMs matters, and is demonstrably correlated to performance.
Bonus Criteria Most Correlated to Traffic Growth
| Full Service |
|---|
| Guest Feedback |
| Quality Metrics |
| Limited Service |
|---|
| Unit Revenue |
| Unit Profits |
© 2025 Black Box Intelligence. Research proprietary to BBI and exclusive to BBI. NOT FOR REDISTRIBUTION
What the Data Says
-
Quick Service average GM payouts moderated to 16.2% of base in 2024 (after 24.7% in 2023).
-
Fast Casual eased to 12.9% in 2024 (from 13.1% in 2023 and 14.0% in 2022).
-
Casual Dining moved from 18.1% (2022) to 15.4% (2023) to 16.0% (2024).
-
Upscale Casual/Fine Dining also stepped down to 26.3% (2024) after 29.3% (2023).
-
Recommendation: If payouts have normalized, protect target bonus levels to demonstrate that you value your staff while incentivizing impactful behaviors, and use thresholds/gates to safeguard margin.
General Manager Bonus Payouts
Average GM bonus payouts declined for the full year 2024 (most recent available data we have) in most segments based on our aggregated averages.
Average Bonus Earned as Percentage of Base Salary
*Average payout higher than average target bonus for the same year.
| 2022 | 2023 | 2024 | |
|---|---|---|---|
| Quick Service | 12.6% | 24.7%* | 16.2%* |
| Fast Casual | 14.0% | 13.1% | 12.9% |
| Family Dining | – | – | 12.6% |
| Casual Dining | 18.1% | 15.4% | 16.0% |
| Upscale Casual/Fine Dining | – | 29.3%* | 26.3%* |
© 2025 Black Box Intelligence. Research proprietary to BBI and exclusive to BBI. NOT FOR REDISTRIBUTION
What the Data Says
-
Quick Service average GM payouts moderated to 16.2% of base in 2024 (after 24.7% in 2023).
-
Fast Casual eased to 12.9% in 2024 (from 13.1% in 2023 and 14.0% in 2022).
-
Casual Dining moved from 18.1% (2022) to 15.4% (2023) to 16.0% (2024).
-
Upscale Casual/Fine Dining also stepped down to 26.3% (2024) after 29.3% (2023).
-
Recommendation: If payouts have normalized, protect target bonus levels to demonstrate that you value your staff while incentivizing impactful behaviors, and use thresholds/gates to safeguard margin.
Restaurant Full-Time Hourly Employees: Emerging Benefits
Clear increase in a handful of specific benefit items clear over the last year or so.
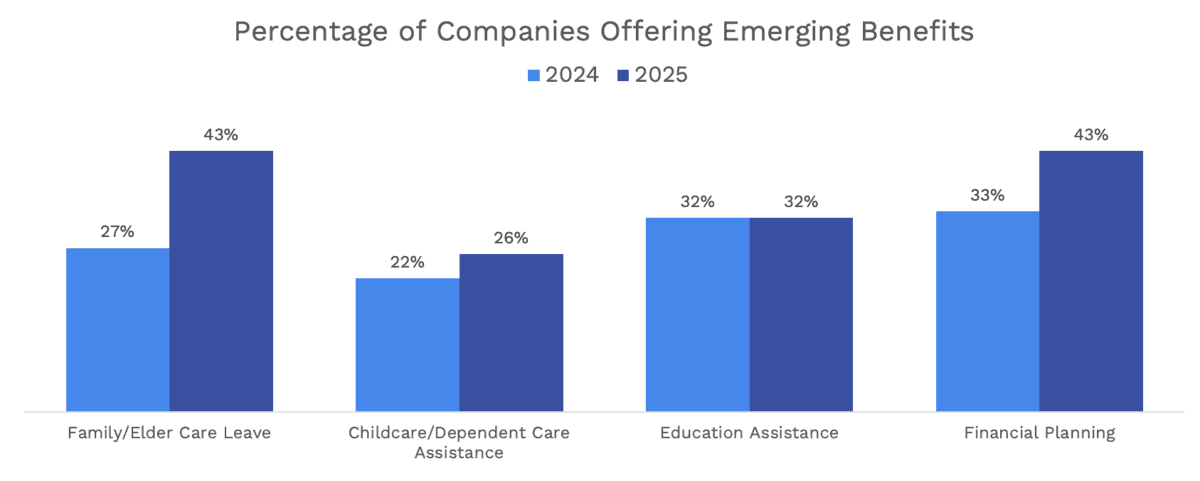
What the Data Says
- Family/Elder Care Leave offerings rose from 27% (2024) to 43% (2025) of companies.
- Childcare/Dependent Care Assistance increased from 22% to 26%.
- Education Assistance held steady at 32%.
- Financial Planning offerings grew from 33% to 43%.
- Recommendation: Advertise care-related benefits in job posts and onboarding; they are rising differentiators for retention-critical roles.
Healthcare Benefits
Health benefits are a measurable retention lever—not just a perk. The data shows that when employers cover more of the premium (target >70%), turnover improves—especially in roles with high replacement costs and long ramp times—while overall employer share now averages ~66%. Plan design also matters: offering an affordable, low-premium option (e.g., an HMO) alongside an HDHP and coaching enrollment at the store level turns eligibility into real participation and steadier teams.
Full-Time Hourly Employees: Health Benefits
*Data shown as difference relative to company’s industry segment.
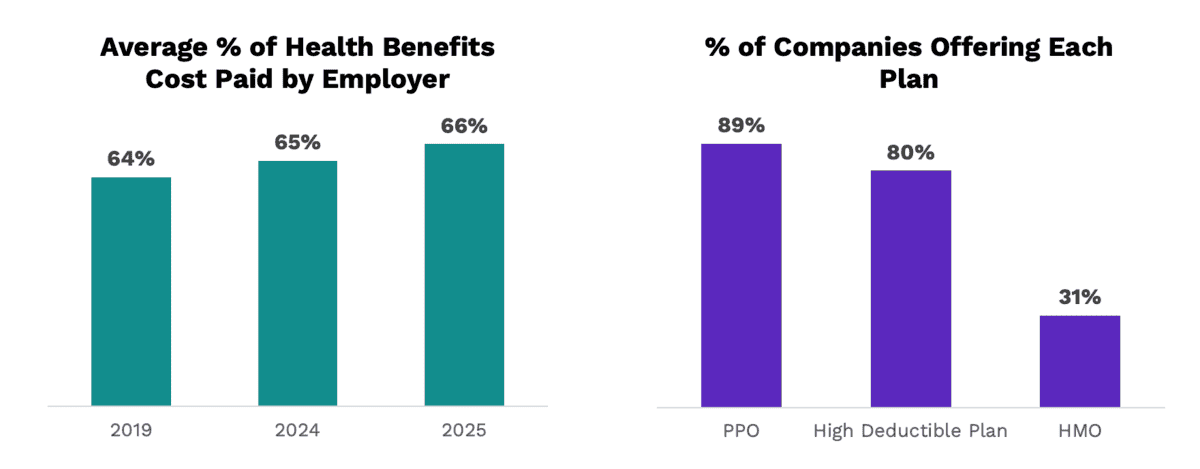
What the Data Says
- Employers now pay ~66% of FTH health costs on average (up from 64% in 2019 and 65% in 2024).
- PPOs are offered by ~89% of companies; HDHPs by ~80%; HMOs by ~31%.
- Plan choice matters for retention: lower-premium options can raise take-up among hourly staff.
- Recommendation: Pair your HDHP with a low-premium HMO or similar option and provide store-level enrollment coaching to boost participation.
Healthcare Benefits Contribution Impact on Employee Turnover
Full Service
Brands paying more than 70% of a General Manager’s health benefits experienced:
Limited Service
Brands paying more than 70% of a full-time hourly employee’s health benefits experienced:
*Data shown as difference relative to company’s industry segment.
© 2025 Black Box Intelligence. Research proprietary to BBI and exclusive to BBI. NOT FOR REDISTRIBUTION
What the Data Says
-
In full service, brands paying >70% of a GM’s health premium saw ~7% better GM turnover versus segment.
-
In limited service, brands paying >70% of full-time hourly premiums saw ~5% better hourly turnover.
-
Higher employer share delivers outsized ROI where replacement costs and ramp time are high.
-
Recommendation: Target employer share >70% for GMs (FS) and full-time hourly (LS), and track turnover deltas to prove ROI.
State of the Workforce Webinar
Where This Data Came From
Everything cited here was originally shared in our annual deep dive webinar into the state of the restaurant workforce, which was taken from our Total Rewards Survey and our Restaurant Performance Network – meaning all insight comes straight from the HR teams and payroll platforms of the biggest restaurant brands in the country.
