Monthly Restaurant Trends Review
Out of the Box: January 2026
-
Weather-Driven Volatility: January’s surface-level growth was possibly a “weather mirage” caused by favorable year-over-year comparisons; subsequent performance will tell a more accurate story.
-
The GM Stability Dividend: Management retention has returned to pre-pandemic levels, with 2025 data showing that Limited Service units with zero GM turnover saw a 1.0 percentage point traffic lift and a 22-point reduction in hourly staff churn.
-
Accelerating Consumer Trade-Downs: With 30% of consumers expecting their financial situation to worsen in 2026, a migration toward value is underway, evidenced by Quick Service and Fast Casual segments already beginning to outperform Casual Dining.


In This Issue:
-
The Big Picture: January 2026 Sales and Traffic Trends
-
Segment Focus: Casual Dining
-
Best vs Worst: Region and Segment
-
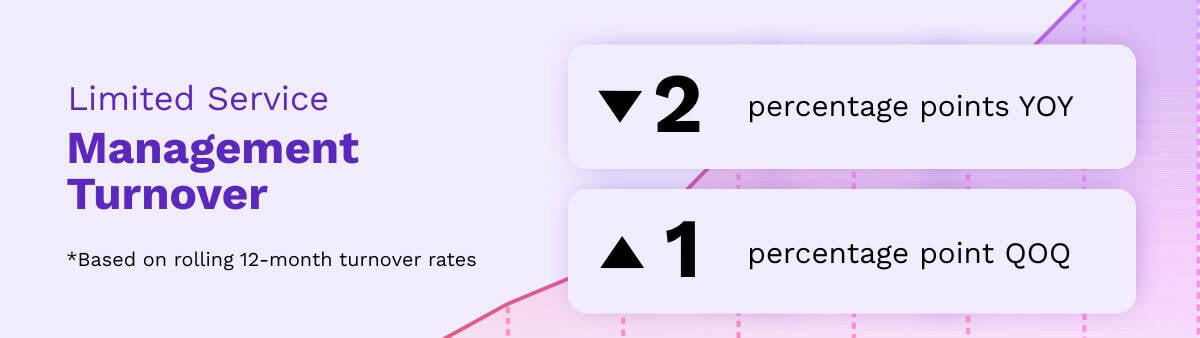
Staffing Review: Limited Service, Management Turnover
January 2026 Restaurant Industry Trends
The Big Picture: Sales and Traffic Trends
January Industry Performance: Weather-Driven Volatility Masking Consumer Reality
The restaurant industry started the year with a misleadingly robust surge, fueled primarily by favorable year-over-year weather comparisons rather than a fundamental shift in consumer behavior.
Weekly Performance Breakdown
-
Weeks 1-3: Same-store sales averaged 4.3% growth.
-
Week 2 Peak: Warmer-than-average temperatures across most of the U.S. drove an extraordinary 8.0% sales spike.
-
Week 4 Correction: As sub-freezing temperatures and winter storms set in, performance plummeted to -9.0% sales growth for the final week.
Monthly Totals & Context
Despite the late-month drop, January finished with 1.0% same-store sales growth—a significant jump from December’s -1.0% and the industry’s strongest showing since September.
Same-store traffic also saw a massive sequential improvement, rising to -1.1% in January from -3.3% in December. While this represents the best traffic growth since August, the upward swing must be tempered.
The Bottom Line: These results likely reflect weather disruptions rather than true consumer strength. Operators should remain cautious before viewing January’s “recovery” as a long-term trend.
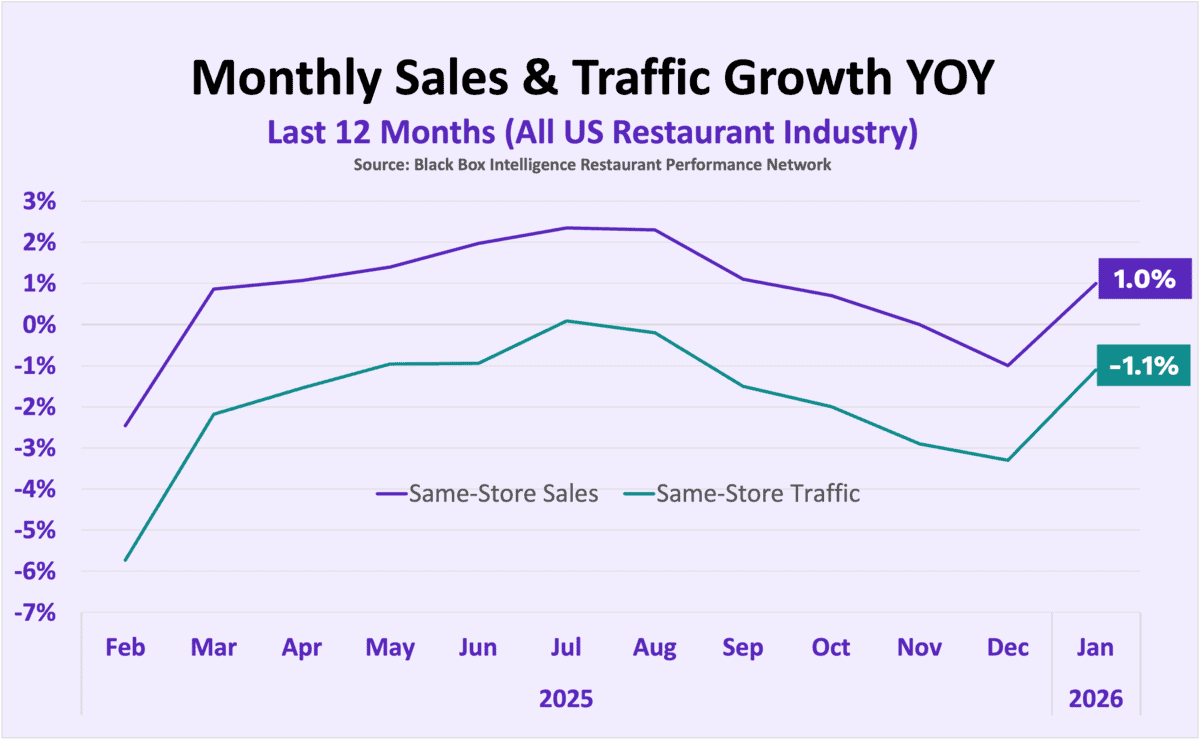
| Month | Feb | Mar. | Apr | May | Jun | July | Aug | Sep | Oct | Nov | Dec | Jan ’26 |
|---|---|---|---|---|---|---|---|---|---|---|---|---|
| Comp. Sales | -2.5% | +0.9% | +1.1% | +1.4% | +2.0% | +2.4% | +2.3% | +1.1% | +0.7% | +0.0% | -1.0% | +1.0% |
| Comp. Traffic | -5.7% | -2.2% | -1.5% | -1.0% | -0.9% | +0.1% | -0.2% | -1.5% | -2.0% | -2.9% | -3.3% | -1.1% |
January 2026 Restaurant Segment Performance
Best vs Worst: Restaurant Industry Segment
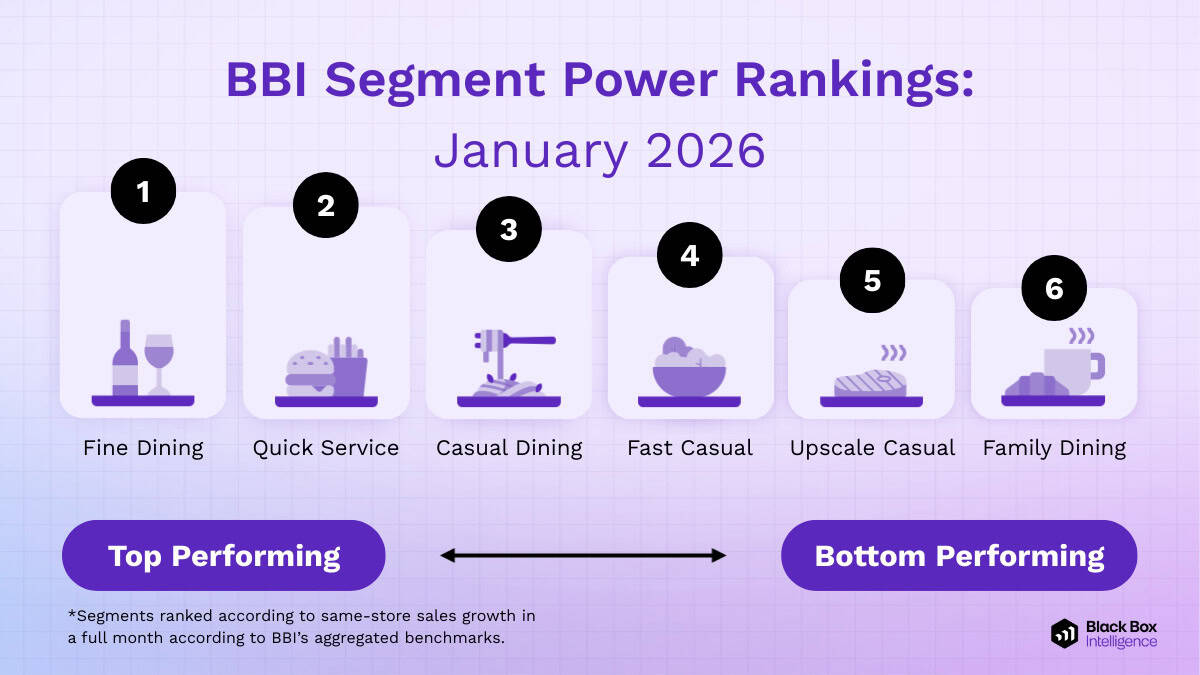
January saw a horizontal lift across the industry, with every segment reporting stronger same-store sales growth compared to December. However, the recovery remains uneven, particularly for segments sensitive to macroeconomic shifts.
Fine Dining: The Industry Outperformer
Fine Dining led the industry in January, continuing a recent resurgence where it has ranked first or second in performance for four consecutive months.
-
Q4 Momentum: Strong results in October and November likely stemmed from “easy laps” against soft 2024 data, while December reflected holiday spending.
-
The Weather Factor: Because Fine Dining relies almost exclusively on the dine-in experience with minimal off-premise revenue, it benefited more than any other segment from the mild weather in early January.
Lagging Segments
Despite the industry-wide lift, two segments failed to achieve positive sales growth:
-
Upscale Casual: Improved sequentially but remains in negative territory.
-
Family Dining: Ranked as the bottom performer for the fourth straight month. This segment continues to struggle as its core consumer remains cautious regarding the broader economic outlook.
January Restaurant Performance: Region Focus
Best vs Worst: Region
Regional Performance: Geographic Recovery Stalled by Winter Storms
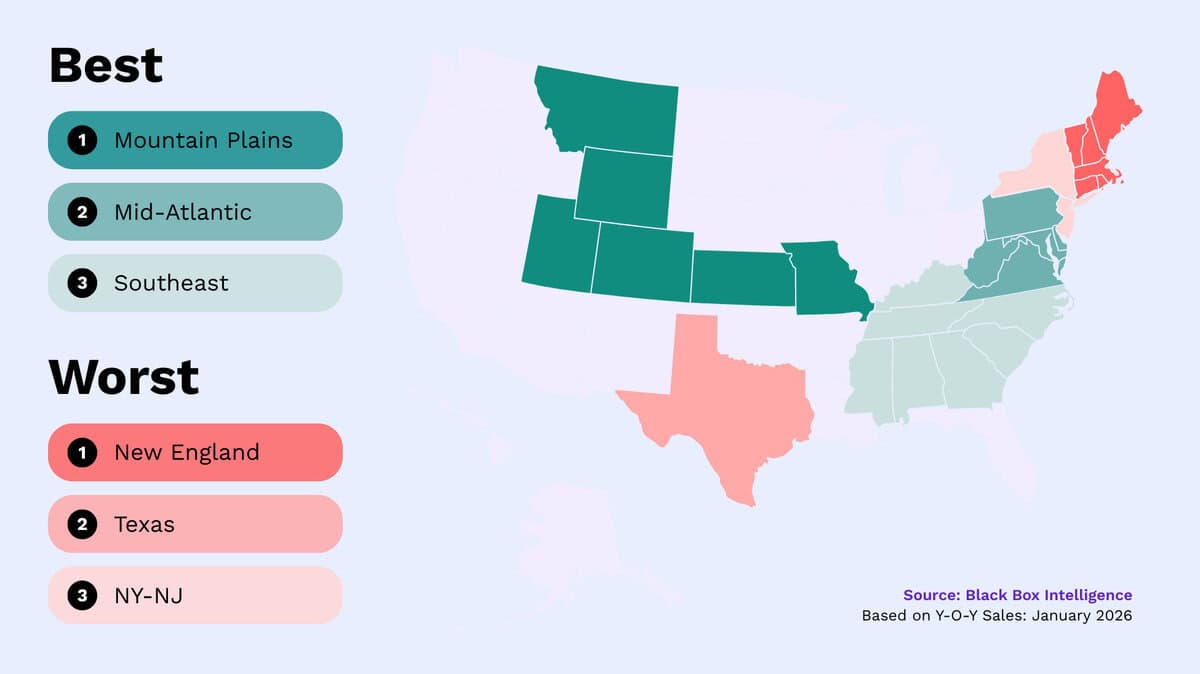
January’s sales rebound was nearly universal across the U.S., with 10 of the 11 tracked regions posting stronger same-store sales growth than in December. However, severe winter weather created a sharp divide between leaders and laggards.
Regional Leaders and Laggards
-
Top Performer: Mountain Plains. This region secured the #1 spot for the second time since November. However, this strength is likely a product of “soft laps” against weak prior-year data, combined with early-month weather tailwinds.
-
Bottom Performer: New England. Currently the worst-performing region, continuing a steady decline from its top-2 ranking seen between March and June of last year.
-
The Storm Factor: Texas. The lone exception to the monthly improvement trend. Texas suffered the industry’s worst downturn in the final week of January, with sales plummeting nearly 21% due to severe winter storms.
Negative Growth Zones
Despite the broad sequential improvement, three regions failed to reach positive sales growth in January:
-
New England
-
Texas
-
New York-New Jersey
The common denominator for these underperformers was sustained exposure to severely cold temperatures and storm disruptions throughout the month.
Restaurant Segment Deep Dive: January 2026
State of Restaurant Segment Performance: Casual Dining
Casual Dining: 2025’s Top Performer Faces a High Bar in 2026
2025 was indisputably the year of Casual Dining. The segment dominated the industry, leading in both same-store sales and traffic growth. Notably, it was the only segment to achieve positive year-over-year traffic growth for the full year.
The Shift to Negative Territory
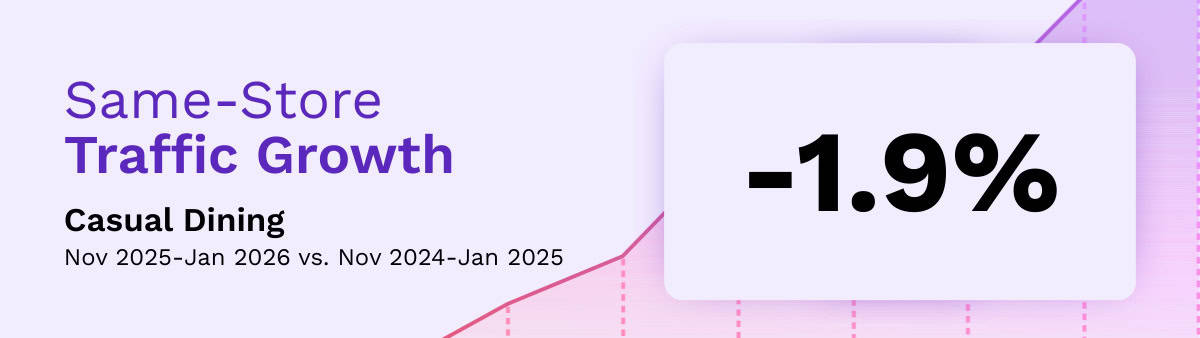
Despite this momentum, even the industry leader is feeling the chill of softening demand. While Casual Dining continued to outperform all other segments in traffic growth over the last three months, it has finally dipped into negative territory:
-
Nov – Jan Traffic: -1.9% year-over-year.
From “Easy Laps” to a High Bar
The segment’s 2025 dominance was partially supported by favorable year-over-year comparisons. In the first three quarters of 2024, traffic for Casual Dining averaged worse than -4.0%.
However, growth improved significantly in Q4 2024. As the calendar turns, Casual Dining now faces a dual challenge:
-
Softening consumer demand.
-
Difficult comparisons against the high performance standards set late last year.
Staffing, Workforce, And Employment Focus
Current Turnover Trends in Limited Service Restaurants
The Direct Link Between GM Stability and Traffic
Black Box Guest Intelligence data reveals a year-long upward trend in guest sentiment regarding food and service. This improvement correlates directly with stabilizing workforce metrics—specifically the reduction in management turnover.
Limited Service: Returning to Pre-Pandemic Stability
Retention improved steadily throughout 2025 for Limited Service concepts. Current management turnover rates have now fallen below 2019 levels, signaling a definitive end to pandemic-era labor volatility. Operators are increasingly reporting historically low turnover across their portfolios.
The “GM Effect” on Performance and Retention
The impact of General Manager (GM) stability is a critical driver of unit-level success. According to 2025 Black Box Intelligence analysis of Limited Service locations:
-
Traffic Lift: Units with zero GM turnover saw same-store traffic nearly 1.0 percentage point higher than those that lost their leader.
-
Operational Ripple Effect: Stable GM leadership led to a massive 22 percentage point reduction in hourly, non-management turnover compared to units with GM churn.
The Bottom Line: Stabilizing the General Manager role is not just an HR win—it is a primary lever for driving traffic and lowering total labor costs through reduced frontline churn.
State of Restaurant Workforce in 2025
Go Deep on the Latest Workforce Trends with Our Comprehensive Annual Research Study
Our Take on State of the Restaurant Industry in February 2026
BBI Says…
“The beginning of 2026 will provide some relief from a year-over-year same-store sales and traffic growth numbers. We already saw it in the January numbers and despite a slow start for February, the expectation is for strong growth the rest of the month. But once the distortion introduced by the winter subsides in March, we will likely return to a harsher reality.
“Consumer sentiment remains at historically low levels, with the prevailing fear among them being an expected acceleration in inflation and higher risks for unemployment. According to the January survey of consumer expectations by the New York Fed, almost 30% of consumers expect their financial situation to be worse in a year, while 42% expect it to remain about the same. By contrast, in January 2025 only 21% of them expected their financial situation to get worse and 43% of them expected it to be about the same in a year. In other words, the consumer is not feeling great right now, and the vast majority of them are not expecting things to get better.
“Income and wealth levels will continue to be a significant factor for consumers, with those in the highest tiers feeling much more comfortable and those with lowest incomes struggling the most. In this fragile environment, we continue to believe trade-downs will accelerate among consumers as they try to moderate their spending while continuing to enjoy the convenience and affordable comfort that dining out can provide. As a preview of what may happen in upcoming months, as of December, Quick Service and Fast Casual were already performing better than Casual Dining based on same-store sales growth. “

Victor Fernandez
Chief Insights Officer
Black Box Intelligence
State of Restaurant Industry
Quarterly Webinar Deepdives
We go into way more detail in our flagship quarterly State of the Industry (SOTI) webinar – our definitive take on the latest developments and a must attend for anyone in the restaurant industry.