Monthly Restaurant Trends Review
Out of the Box: October 2025
-
October comps: Same-store sales +0.7% YoY (traffic -2.0%)—moderating but still positive on sales amid tougher macro.
-
Segments: Most segments remained in positive same store sales; Fine Dining returned to growth and led sales (traffic still soft). Only Family Dining and Fast Casual declined.
-
Regions: Florida led for the 3rd straight month, with Midwest and Mid-Atlantic close behind; California was the main drag.
-
Workforce tailwind: Retention improved—Full Service non-management turnover 11 pp below 2019; Limited Service management turnover 2 pp below 2019 and 4 pp lower YoY; low-turnover brands saw about +1.0 pp stronger traffic.


In This Issue:
-
The Big Picture: October Sales and Traffic Trends
-
Segment Focus: Fast Casual
-
Best vs Worst: Region and Segment
-
Staffing Review: Full Service, Non-Management Turnover
October 2025 Restaurant Industry Trends
The Big Picture: Sales and Traffic Trends
The weakening economy is finally reflecting in restaurant performance, with September marking the second consecutive month of worsening year-over-year growth. This confirms the narrative that the industry is slowing down in the second half of the year.
The trend is sobering: after five months of improvement starting in March, we have now seen a steady erosion of performance since July. Each month has posted softer results than the one before it. Given the context of rising unemployment, weak hiring, ticking inflation, and a looming government shutdown, it is unfortunately no surprise that consumers are pulling back.
-
October’s same-store sales growth dropped to 0.7%, a 0.5 percentage point decline from September. This makes October the worst month for sales growth since February.
-
Same-store traffic growth fell to -2.0%, a 0.7 percentage point drop from September. This represents the industry’s weakest traffic performance since March.
Same-store traffic growth fell to -2.9%, a sharp drop from the -2.0% reported in October. This represents the industry’s worst traffic performance since February.
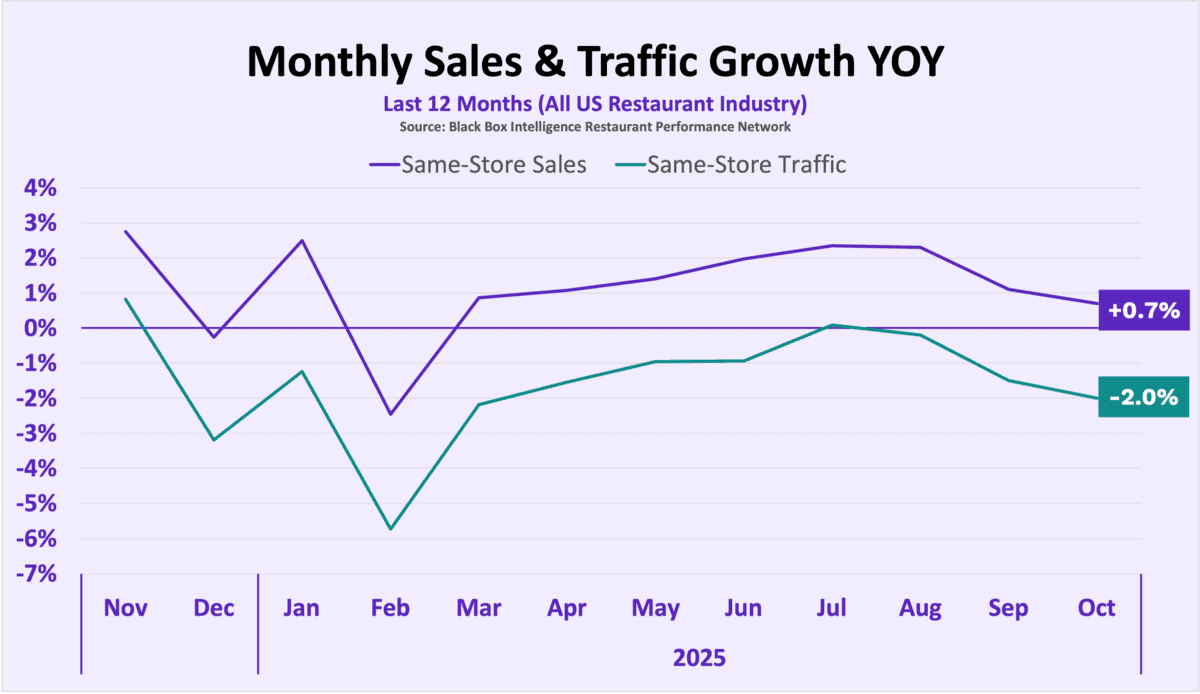
| Month | Nov. ’24 | Dec. ’24 | Jan. | Feb. | Mar. | Apr. | May | Jun. | July | Aug | Sep | Oct |
|---|---|---|---|---|---|---|---|---|---|---|---|---|
| Comp. Sales | +2.8% | -0.3% | +2.5% | -2.5% | +0.9% | +1.1% | +1.4% | +2.0% | +2.4% | +2.3% | +1.1% | +0.7% |
| Comp. Traffic | +0.9% | -3.2% | -1.3% | -5.7% | -2.2% | -1.5% | -1.0% | -0.9% | +0.1% | -0.2% | -1.5% | -2.0% |
November 2025 Restaurant Segment Performance
Best vs Worst: Restaurant Industry Segment
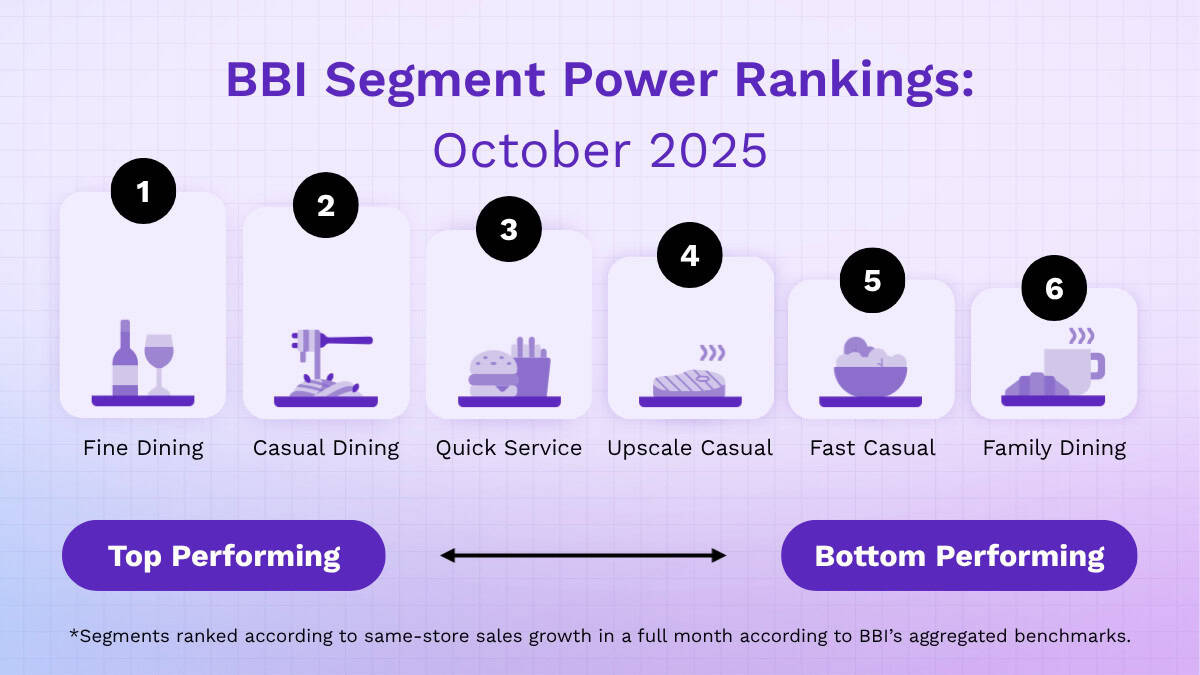
There is a glimmer of good news: only two segments—Family Dining and Fast Casual—saw negative same-store sales growth in October, an improvement from three segments the prior month.
Fine Dining flipped to positive growth, taking the top spot for sales performance, but the underlying drivers paint a complex picture:
-
It is a pricing story: While Fine Dining led in sales, it was the second-worst segment for traffic. Skyrocketing beef prices have forced average checks higher; this lifted sales figures but likely deterred guests.
-
Comparisons are misleading: The segment’s strong showing was aided by an easy comparison against a weak October 2024. When calculated on a 2-year basis, Fine Dining drops to the second-worst spot, trailing only Family Dining.
Unfortunately, Family Dining continues to face significant headwinds. The segment has now posted negative same-store sales growth for two consecutive months and ranked last in both sales and traffic for October. Performance was weighed down primarily by very soft, negative dinner sales; while lunch performed relatively better, it still failed to reach positive territory year over year.
November Restaurant Performance: Region Focus
Best vs Worst: Region
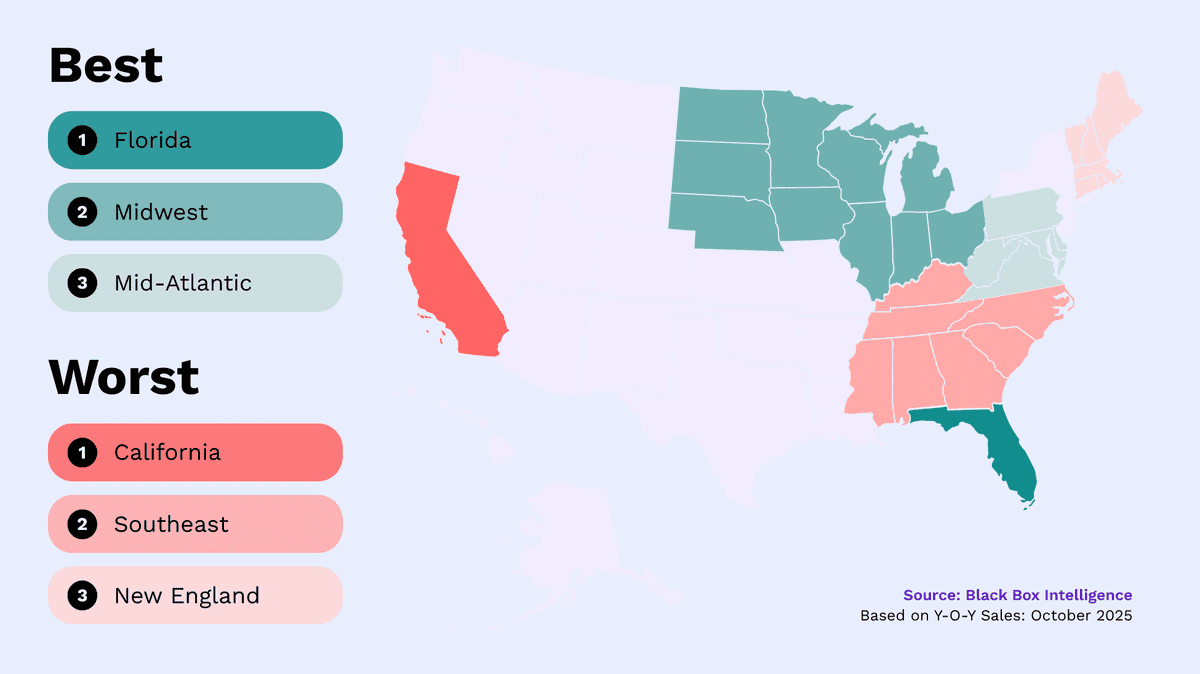
Florida led the country in same-store sales growth for the third consecutive month. However, this performance was largely driven by a mild hurricane season compared to the destructive weather of 2024. Last year, Florida faced storms in August, September, and October—including Hurricane Milton (Category 3). Consequently, strong growth in October 2025 is less about a demand boom and more about easy year-over-year comparisons.
The Midwest and Mid-Atlantic followed as top performers. Similar to Florida, the Mid-Atlantic’s results likely benefited from favorable comparisons against last year’s active hurricane season.
Sadly, California remains at the opposite end of the spectrum. The region has posted negative same-store sales growth for eight months this year—including the last two—and has consistently ranked as the country’s worst-performing region since March.
The state continues to be plagued by job losses and slow economic growth, resulting in one of the highest unemployment rates in the nation. Unfortunately, key sectors—technology, manufacturing, and entertainment—have all shown significant employment weakness this year, weighing heavily on restaurant performance.
Restaurant Segment Deep Dive: October 2025
State of Restaurant Segment Performance: Fast Casual
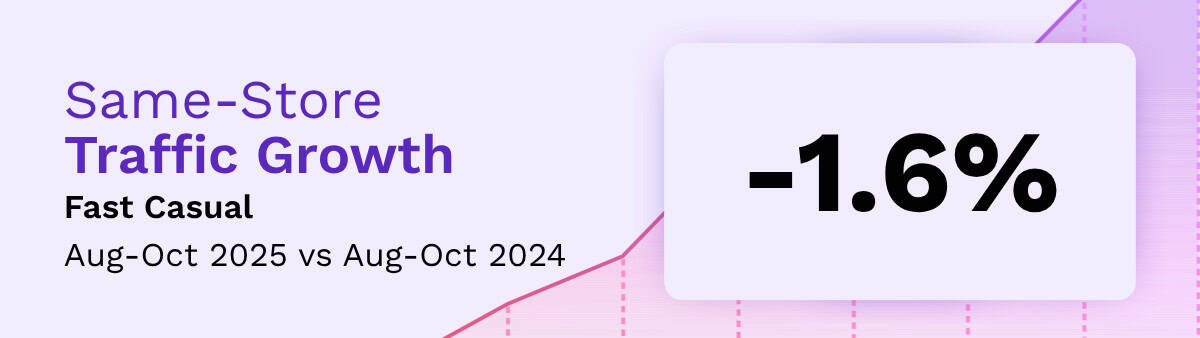
Fast Casual has been a traffic winner in recent years—No. 1 in same-store traffic growth in 2023 and 2024, and second so far in 2025, trailing only Casual Dining.
But its edge has faded since July. By October, Fast Casual ranked fourth in same-store traffic growth. One likely drag: accelerating average check growth. After rising +1.1% YoY in Q2 2025, average spending per transaction has climbed to +1.8% since August, with October marking the segment’s highest check growth since February.
Staffing, Workforce, And Employment Focus
Current Turnover Trends in Full Service Restaurants
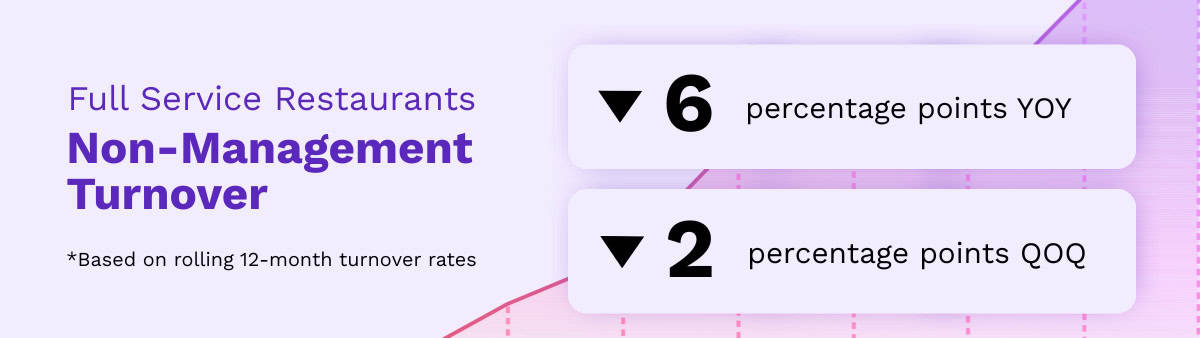
Employee retention has been bright spot for restaurants in 2025—especially among non-management teams. In Full Service restaurants, rolling 12-month turnover keeps easing and now sits well below pre-pandemic levels. As of September, non-management turnover in Full Service was 11 percentage points lower than in 2019.
A softer labor market is helping. With hiring rates down, employees have fewer outside options, and unemployment is expected to edge higher through year-end and stay elevated into early 2026—conditions that should keep turnover stable and give operators more relief.
That relief pays off. Beyond lower replacement costs, stronger retention improves execution and guest satisfaction, which drives better results. Black Box Intelligence data shows Full Service companies in the lowest 25% for turnover delivered about +1.0 percentage point higher same-store traffic growth than peers.
State of Restaurant Workforce in 2025
Go Deep on the Latest Workforce Trends with Our Comprehensive Annual Research Study
Our Take on State of the Restaurant Industry in October 2025
BBI Says…
“The industry faces significant headwinds that are likely to persist into early 2026: a softening labor market, rising inflation, and cautious consumer sentiment. Inflation is a mixed picture—overall food prices are climbing, but the gap between restaurant price inflation and grocery inflation narrowed to its lowest level since early 2023, and forecasts suggest that gap will be smaller in 2026 than in recent years.
“Consumers—especially middle- and lower-income households—are growing more cautious, and recent Black Box Intelligence data shows a corresponding pullback in sales and traffic. We expect performance to remain challenged in the coming months, and 2026 is also likely to be a softer year given pressure on disposable income, higher unemployment, and inflation.”

State of Restaurant Industry
Quarterly Webinar Deepdives
We go into way more detail in our flagship quarterly State of the Industry (SOTI) webinar – our definitive take on the latest developments and a must attend for anyone in the restaurant industry.