Monthly Restaurant Trends Review
Out of the Box: March 2026
-
The Weather Mirage Fades: Fading tailwinds and macro pressures drove a sharp deceleration, pushing traffic to -2.3%—the eighth consecutive month of negative growth.
-
The $3.50 Gas Tipping Point: Gas prices crossing $3.50 triggered an immediate pullback in visits, neutralizing any potential boost from higher tax refunds.
-
The K-Shaped Recovery: A bifurcated consumer reality is rewarding the extremes. Only Quick Service and Upscale Casual improved year-over-year sales growth.
-
The Wage Investment Dividend: Pandemic-era wage investments are yielding massive retention dividends, driving Limited Service non-management turnover 20 percentage points below 2019 levels.


In This Issue:
-
The Big Picture: March 2026 Sales and Traffic Trends
-
Segment Focus: Upscale Casual
-
Best vs Worst: Region and Segment
-
Staffing Review: Limited Service Restaurants, Non-Management
March 2026 Restaurant Industry Trends
The Big Picture: Sales and Traffic Trends
March Industry Performance: The Weather Mirage Fades as Macro Pressures Mount
As anticipated, the weather-driven tailwinds of early Q1 dissipated in March. However, a sudden spike in gas prices—compounded by broader inflationary pressures and geopolitical uncertainty—drove a much sharper deceleration in restaurant performance than initially expected.
Macro Headwinds: Gas Prices vs Tax Refunds
-
The $3.50 Tipping Point: Black Box Intelligence analysis reveals a clear threshold: guest visits reliably pull back when the national average price of regular gas crosses $3.50. The industry crossed that line during the week of March 9, triggering an immediate cooling effect on traffic.
-
The Refund Disconnect: Notably, this deceleration occurred despite consumers having more cash on hand. According to the IRS, the average tax refund is currently tracking $346 higher than at this same point last year, yet those extra dollars are not translating into restaurant visits.
March by the Numbers
The combination of fading weather tailwinds and rising macro pressures resulted in the third-worst performance of the last 13 months, trailing only the holiday-driven slump of November and December.
-
Same-Store Sales: +0.7% (a steep 1.0 percentage point deceleration from February).
-
Same-Store Traffic: -2.3% (a 0.3 percentage point slide from February). This marks the eighth consecutive month of negative traffic growth for the industry.
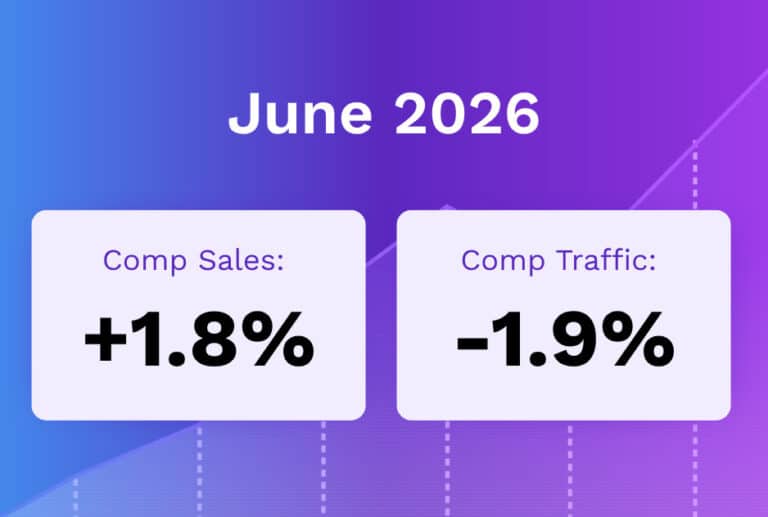
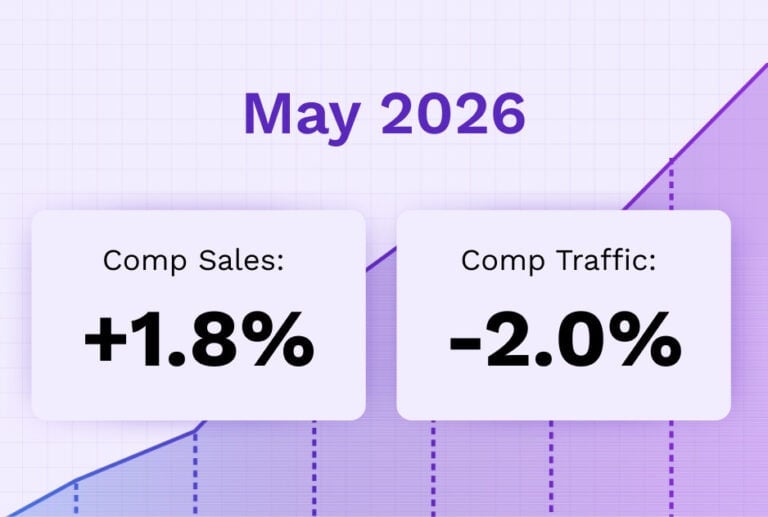
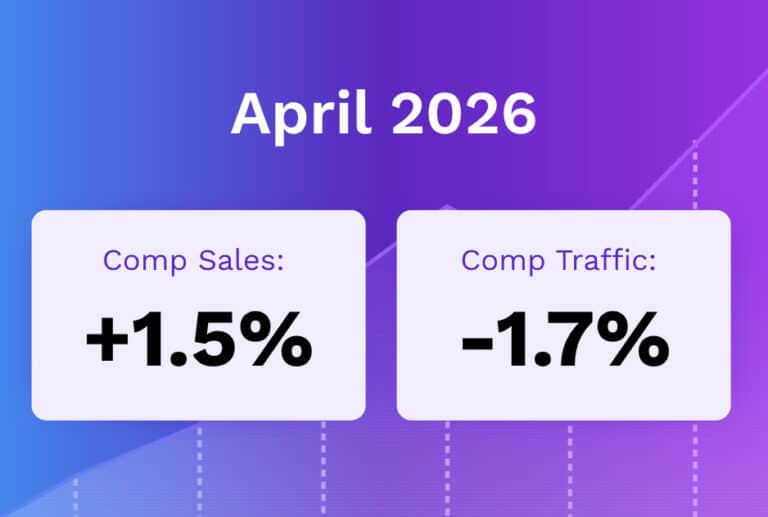
| Month | Apr ’25 | May | Jun | July | Aug | Sep | Oct | Nov | Dec | Jan ’26 | Feb | Mar |
|---|---|---|---|---|---|---|---|---|---|---|---|---|
| Comp. Sales | +1.1% | +1.4% | +2.0% | +2.4% | +2.3% | +1.1% | +0.7% | +0.0% | -1.0% | +1.0% | +1.6% | +0.7% |
| Comp. Traffic | -1.5% | -1.0% | -0.9% | +0.1% | -0.2% | -1.5% | -2.0% | -2.9% | -3.3% | -1.1% | -2.0% | -2.3% |
March 2026 Restaurant Segment Performance
Best vs Worst: Restaurant Industry Segment
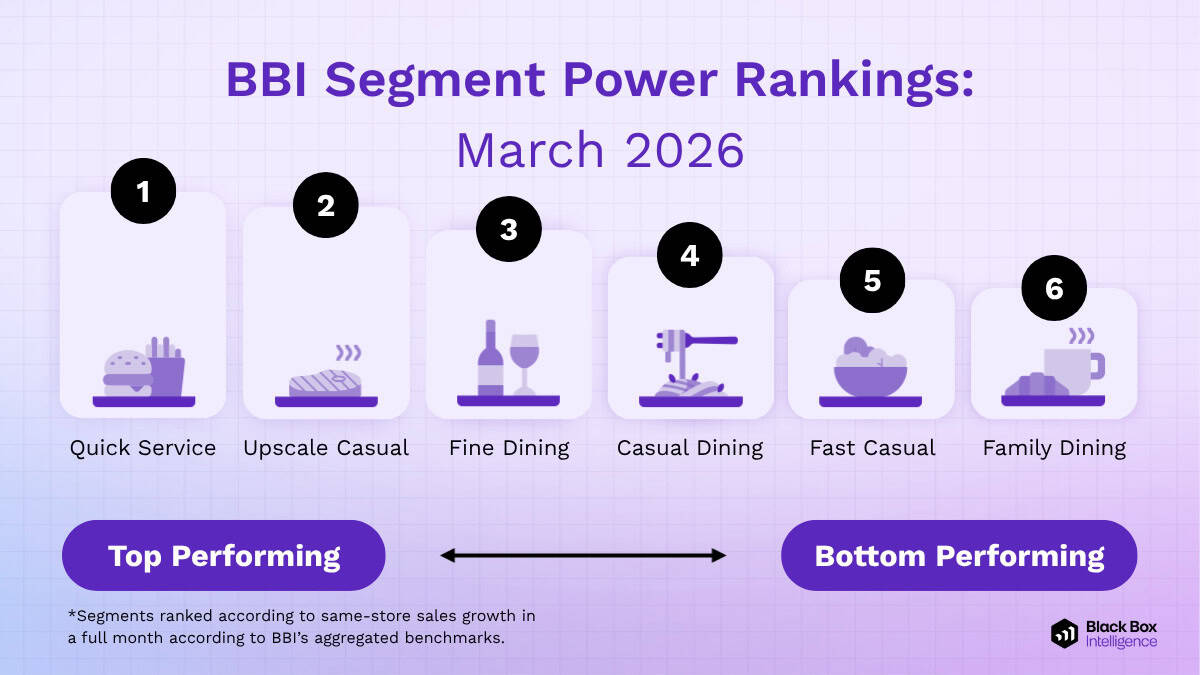
Gas Prices Accelerate the Trade-Down Effect
The impact of rising gas prices is not felt equally across the industry. Instead, fuel-driven inflation acts as a direct catalyst for consumer trade-downs, pushing guests toward lower price points as they look to protect their wallets.
This dynamic crowned Quick Service (QSR) as the undisputed top-performing segment in March. In fact, QSR and Upscale Casual were the only two segments in the industry to improve their year-over-year same-store sales growth compared to February.
The Vulnerable Middle: Casual and Family Dining
Conversely, our analysis shows that rising gas prices disproportionately impact middle-tier dining. We are seeing this play out in real time as guests migrate away from these segments:
-
Casual Dining: Experienced the second-worst slowdown in year-over-year sales growth compared to February. This relative softness is a clear indicator of the accelerating trade-down effect as the economic environment toughens.
-
Family Dining: Already facing severe headwinds as the worst-performing segment since October, Family Dining is taking a compounding hit. The rapid rise at the pump will continue to severely hurt this segment if these macro pressures remain unresolved.
March Restaurant Performance: Region Focus
Best vs Worst: Region
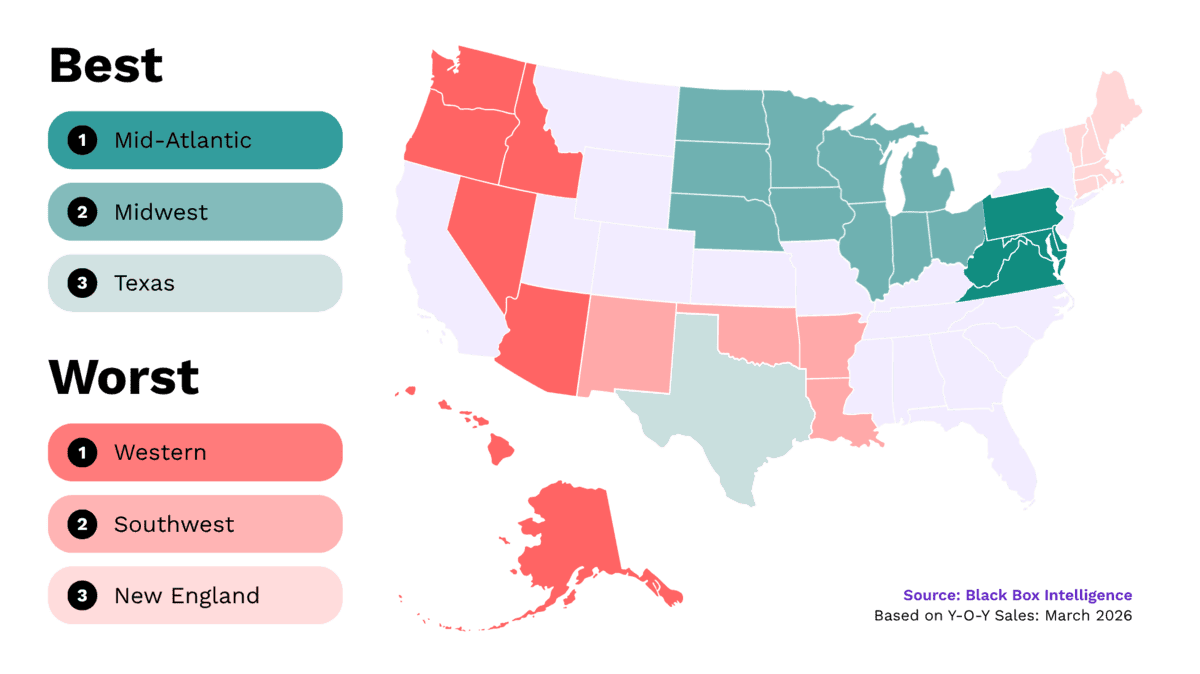
Regional Performance: Broad Deceleration Masked by Favorable Laps
March brought a widespread downturn across the country, with 8 of the 11 tracked regions experiencing a deceleration in same-store sales growth compared to February. The only three regions to buck this trend—the Southeast, Mid-Atlantic, and New York-New Jersey—did so largely because they were lapping severe February weather events that artificially depressed their prior-month numbers.
Mid-Atlantic: Sustained Strength Regained
The Mid-Atlantic secured the top spot for same-store sales growth in March. This marks a return to form for the region, which has ranked in the top three during four of the last six months. Its temporary dip in February was merely a weather-driven outlier rather than a fundamental shift in unit performance.
New England: A Persistent Laggard
On the opposite end of the spectrum, New England posted the weakest same-store sales growth in the country and was one of only three regions to slip into negative year-over-year territory. This is not a short-term anomaly; the region has struggled consistently, languishing in the bottom three for five of the last eight months.
Restaurant Segment Deep Dive: March 2026
State of Restaurant Segment Performance: Upscale Casual
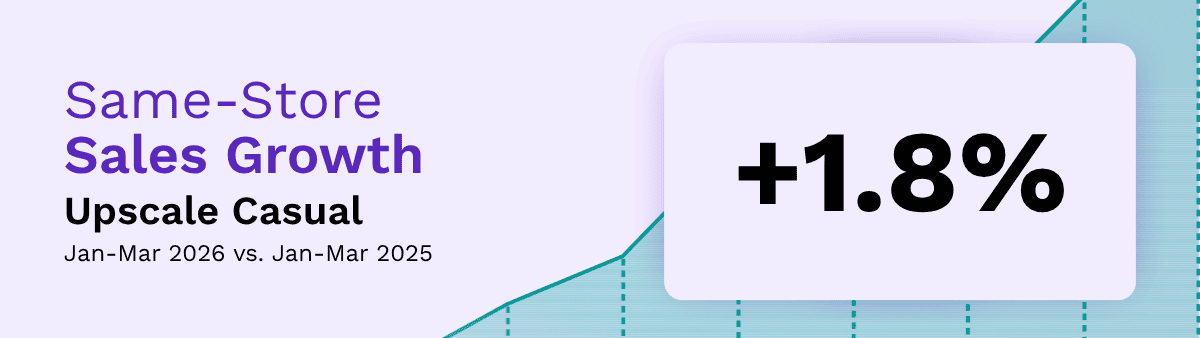
Upscale Casual: Shielded by the K-Shaped Economy
Upscale Casual continues to demonstrate remarkable resilience against macroeconomic headwinds. The segment ranked second in same-store sales growth in March—trailing only Quick Service—and has consistently secured a top-half performance spot every month since July.
The Inflation Buffer
While rising gas prices and compounding inflation are severely squeezing downstream full-service competitors like Casual and Family Dining, Upscale Casual remains largely insulated. Its higher average check and core guest profile provide a built-in buffer against the current economic challenges pulling down the rest of the industry.
The 2026 “Barbell” Effect
Current restaurant performance perfectly illustrates the much-discussed “K-shaped” economy. Higher-income individuals are sustaining their consumption, continuing to reward elevated dining experiences while lower-income consumers pull back. As a result, the highest sales growth so far in 2026 is concentrated at the two extremes of the industry spectrum:
-
Premium Dining (Upscale Casual & Fine Dining): Capturing the resilient, high-income guest whose spending remains uninterrupted by inflation.
-
Value & Convenience (Quick Service): Capturing the budget-conscious guest accelerating their trade-downs away from traditional full-service.
State of Restaurant Workforce in 2026
Go Deep on the Latest Workforce Trends with Our Comprehensive Annual Research Study
Staffing, Workforce, And Employment Focus
Current Turnover Trends in Limited Service Restaurants
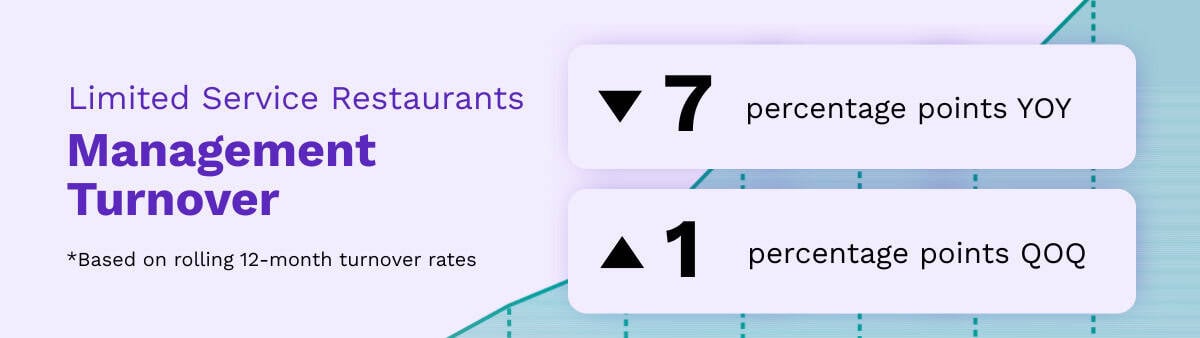
Wage Growth and a Soft Macro Market Drive Retention
A softening macroeconomic labor market continues to create a highly favorable staffing environment for operators. Retention is improving dramatically: rolling 12-month turnover for non-management employees in Limited Service is down 7 percentage points year-over-year, and has plummeted more than 20 percentage points compared to pre-pandemic 2019 levels.
The Compensation Correction
This stabilization is largely the result of aggressive, pandemic-era compensation corrections finally paying off. According to Black Box Intelligence data, the median hourly wage for Limited Service crew members has surged 40% over the last five years—fueled by double-digit spikes in 2022 and 2023. For context, average hourly earnings across the broader U.S. private sector rose just 24% during that same period.
The Two-Pronged Retention Driver
Because base pay remains a primary driver of turnover, the industry’s success in “catching up” to competing sectors has effectively curbed frontline churn. Operators are currently benefiting from a dual-tailwind:
-
Competitive parity: Restaurant wages are now highly competitive with alternative hourly industries.
-
Economic hesitation: With hiring slowing down across the broader economy, employees are increasingly choosing to stay put rather than risk testing a cool job market.
Our Take on State of the Restaurant Industry in March 2026
BBI Says…
“Consumers have shown remarkable resilience, consistently prioritizing restaurants to the point where foodservice continues to widen its ‘share of stomach’ gap over grocery. As of Q1 2026, restaurants represent the third-largest category in retail sales, trailing only motor vehicles and e-commerce. However, a tipping point has arrived. With inflation rebounding, gas prices sustained above $3.50, and consumer sentiment plummeting, we are entering an environment where guests are forced to pull back.
“March data offers a stark preview of this slowdown, with year-to-date traffic now sitting at -2.0%. The anticipated tailwind from tax season fell flat; the $352 average increase in refunds provided far less spending power than the $1,000 originally estimated. When paired with record-high consumer debt, those limited extra dollars are being quickly absorbed by competing categories rather than discretionary dining.
“As economic pressures mount, the trade-down effect will accelerate rapidly. This macroeconomic squeeze leaves Family and Casual Dining highly vulnerable as guests seek to protect their wallets. Conversely, these disruptions strengthen our thesis that Fast Casual and Quick Service brands remain the best positioned to capture migrating guests and endure the softening conditions ahead.”

Victor Fernandez
Chief Insights Officer
Black Box Intelligence
State of Restaurant Industry
Quarterly Webinar Deepdives
We go into way more detail in our flagship quarterly State of the Industry (SOTI) webinar – our definitive take on the latest developments and a must attend for anyone in the restaurant industry.